Most UFC betting is driven by narrative and highlight reels. A fighter looks dangerous in their last fight, the public lays heavy juice, and the line moves to a price that bears no relationship to the actual matchup. That dynamic is exactly the gap a structured UFC betting model exploits. This piece walks through the features that consistently carry signal in MMA, the ones that look great in highlights but are actually noise, and how to put them together into a workable predictive model for fight cards.
Why MMA is unusually hard to model
Three reasons. First, the sport is high-variance — a single punch can end any fight, and 130-pound differences in striking output sometimes do not predict 60-second knockouts. Second, the sample size per fighter is tiny. A 10-fight UFC career is a generous data set; many fighters bet on heavily have 4 or 5 fights to draw from. Third, weight class and styles cluster — modeling lightweights with heavyweight features will produce garbage.
Despite all that, MMA is profitable for disciplined bettors because the public bets the bigger name, the bigger highlight reel, and the more recent finish. The market is not as sharp as NFL or NBA. The opportunity is real if you bring real features.
Features that carry actual signal
Striking differential per minute
The single most predictive metric in MMA is significant strikes landed per minute minus significant strikes absorbed per minute, adjusted for opponent quality. A fighter who lands 5.0 SLpM and absorbs 3.0 SApM has a +2.0 striking differential. Career averages stabilize after 5-6 fights and predict outcomes better than recent-form measures alone.
Takedown defense and accuracy
Takedown defense is more predictive than takedown accuracy in most matchups. A wrestler with 70% TD accuracy faces a striker with 90% TD defense — the realized takedown rate is closer to 30%, and the fight will be contested standing. Account for the opponent's defensive numbers, not just the offensive ones.
Age and the decline curve
UFC fighters peak between 28 and 32 in most weight classes, with heavier weights aging slightly later. The decline is not linear — it tends to be a step function around age 35, especially for fighters who have absorbed a lot of damage. A 36-year-old with 200+ career significant strikes absorbed is a fundamentally different fighter than the same name two years prior, and the public is slow to update.
Weight cut history
Recent failed weight cuts are a strong negative signal. A fighter who missed weight in their last fight or weighed in 5+ pounds heavy at the morning weigh-in has a roughly 3-5 percentage point drop in win probability, depending on weight class. Watch for second-day weigh-ins on PFL or USADA-tested rosters.
Style matchups
Pure offensive numbers miss the rock-paper-scissors of MMA. A high-volume kickboxer beats a low-volume technician on cardio. A wrestler with no submission game beats a striker but loses to a Brazilian jiu-jitsu specialist. Encoding style buckets (kickboxer, wrestler, BJJ specialist, hybrid) and pairwise matchup edges adds real lift to a model.
Features that look meaningful but are noise
- Win streaks longer than 4 fights in non-contender matchups. Padding records vs cans does not predict championship-level performance.
- Knockout percentage in standing context without normalizing for opponents. Fighters who knock out gatekeepers do not always knock out top-15 opposition.
- Camp changes. The MMA media loves "fighter changed camps and looks reborn." The data says camp changes have near-zero predictive power on their own.
- Reach advantage in isolation. Reach matters in some style matchups (rangy striker vs pressure brawler) but is not universally predictive.
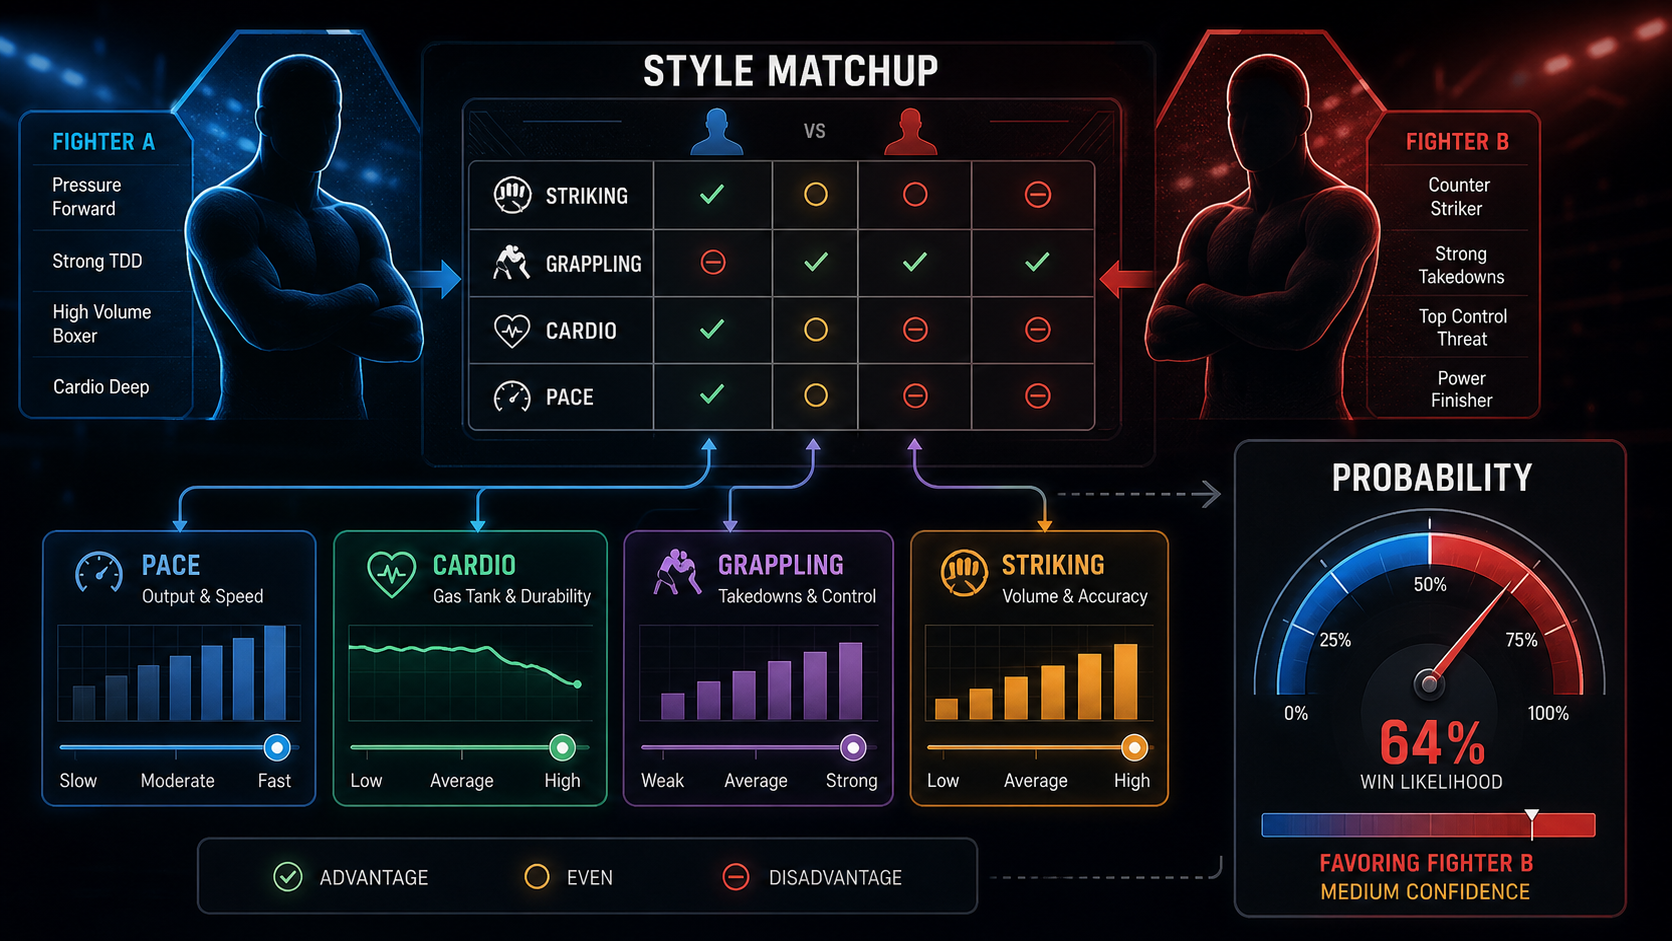
A worked example with concrete numbers
Suppose your model outputs a fight projection like this:
- Fighter A: 4.8 SLpM, 2.9 SApM, 75% TD defense, age 29, no missed weights
- Fighter B: 4.1 SLpM, 4.0 SApM, 50% TD defense, age 33, missed weight 1 of last 3
- Style matchup: kickboxer vs hybrid striker-wrestler
The market line opens Fighter A -160 (implied 61.5%). Your model output puts Fighter A at 70% based on:
- Striking differential edge of +1.9 — about +6 percentage points of win probability
- Age gap of 4 years on the wrong side of the curve for B — +3 percentage points
- Weight-cut concern on B — +2 percentage points
- Style matchup neutral — 0 adjustment
That puts your fair price at -233. The market price -160 has implied probability 61.5%. Your edge is 70% true probability vs 61.5% implied, which is roughly +13.8% expected value per dollar on a Fighter A moneyline ticket. That is a real bet — if your model is calibrated. If it is not, you are reading your own confirmation bias as edge. The difference between those two is what backtesting tells you.
Method-of-victory props
Method-of-victory markets (KO/TKO, submission, decision) are where MMA props get fun and where the public misprices most often. A few patterns:
- The "by KO" market is overbet for popular knockout artists. The public pays a steep premium on highlight-reel finishers, even when their actual KO rate against tier-1 opposition is mid.
- "Decision" tickets are underbet when both fighters have high finish rates, even if their styles cancel each other out into 15 minutes of feeling-out exchanges.
- "By submission" props are the cleanest math. Sub specialists vs non-grapplers have predictable rates that don't move much fight to fight.
Round totals: O/U 1.5 and O/U 2.5
Round totals are derivative of finish rates and pace. A pair of high-finish fighters in a featherweight matchup is a different distribution than two heavyweights with low cardio and big power. Two filters help:
- Combined finish rate — average of both fighters' (KO + sub) per fight rate.
- Pace — combined SLpM. Fights with 7+ combined SLpM are more likely to end early because volume creates damage.
An O/U 2.5 round line on a heavyweight title fight where both fighters have 70%+ finish rates is often the under at any reasonable price. Same line in a flyweight technical matchup is often the over — neither fighter finishes, and you cash on the third round bell.
Building this in the Workshop
The Workshop currently focuses on team-sport features, but the modeling discipline carries over. The features above (striking differential, TD defense, age, recent weigh-in misses) can be encoded as numeric or binary inputs and trained against fight outcomes. The validation set is critical — UFC has only 500-700 fights per year, so a 1-year holdout is small. Use 3+ years of training data and test on 1. From there, wrap the features into a deployable artifact at Build → New model so closing-line value gets logged on every fight you grade against the market.
Cross-sport modeling templates that adapt to UFC: see glass-box vs black-box models for why a small-sample combat-sport build benefits from an interpretable feature set rather than a deep tree, and building your first model for the broader regression-vs-tree decision applied to sparse data.
Common mistakes
- Betting heavy moneyline favorites without checking implied probability vs your true probability. A -400 favorite is +33% EV territory only if your model says they win 85%+ of the time.
- Riding a fighter's "form" off two highlight finishes. Two-fight samples are noise.
- Ignoring weight class trends. What predicts heavyweight outcomes (power, cardio cliff, single-shot finishes) does not predict featherweight outcomes (volume, scrambles, decisions).
- Underweighting damage history. A fighter coming off a war absorbs damage that does not show up on the next fight's tape. Two-fight rest and old-fighter tape both matter.
Sample fight-night workflow
A typical Saturday workflow for a 12-fight UFC card:
- Pull all 24 fighters'' UFC statistics — SLpM, SApM, TD acc, TD def, sub attempts per 15 min, knockdown rate, control time.
- Apply opponent-quality adjustments to each metric. A 5.0 SLpM against tier-3 opposition is not the same as 5.0 against tier-1.
- Look up weigh-in result. Flag any miss or borderline morning-of weight.
- Compute age and damage-absorbed prior. Post-35 fighters with 200+ career SApM get a step-function penalty.
- Style-bucket each matchup. Kickboxer vs wrestler, BJJ specialist vs striker, hybrid vs hybrid.
- Run the model. Compare projected win probability vs market implied probability for each fight.
- Cross-check method-of-victory projections vs posted props. Flag method props with 5+ percentage points of disagreement.
- Cross-check round totals vs combined finish rate and combined SLpM.
- Size bets by Kelly or half-Kelly tied to edge. Maximum exposure per fight night caps single-card variance.
Marketplace UFC model snippets
Search the model marketplace for "UFC fight-night" templates. A handful of public Tinker-published combat-sport models include the opponent-adjusted SLpM feature, weight-cut binary, and age-step encoding as forkable Blocks. The closing-line-value column shows which ones have actually held up across the last several cards — that filter is the fastest way to skip 20 hours of feature engineering and start with a working baseline you can iterate from.
Tracking edge with public accountability
The single hardest part of UFC modeling is convincing yourself the edge is real and not 15-fight luck. The model leaderboards log every public UFC model''s closing-line-value across the year. Cross-checking your own model''s CLV against the published baselines tells you, in roughly 200 bets, whether your edge is in the same neighbourhood as the top public builders. Without that public reference point, every losing card feels catastrophic and every winning card feels like genius — neither is informative.
DFS overlay for UFC slates
DFS UFC contests live on every major site, and the field is consistently slower to update on weight-cut news, late-replacement fights, and reach mismatches than the moneyline market. The Gridiron contest hub shows field positioning across the slate so you can identify whether the public is overweighted to a popular knockout artist whose model-implied win probability is below their DFS ownership. Same model, two revenue streams — sportsbook line lag plus DFS leverage.
Bottom line
UFC betting models built on striking differential, takedown defense, age curves, and weight-cut history beat the public consistently because the public bets names and recent finishes. Add a style-matchup layer and a method-of-victory adjustment, validate on a real holdout, and you have a workable framework. Method-of-victory and round-total props offer additional spots where the public misprices the market, especially around popular knockout artists.
For team-sport modeling templates, see the Workshop, and for cross-sport prop tracking the player props page covers leagues where data depth supports automated projections. UFC modeling is a long road but a profitable one for the patient.
Bet responsibly — set limits, never chase losses.
UFC example board
A fight-night model should describe paths, not just winners. Islam Makhachev is the clean grappling-control example: takedown success, top time, and submission threat can all point in the same direction. Alex Pereira is the striking-power example where knockout equity can outrun minute-by-minute control metrics. Ilia Topuria and Tom Aspinall are useful pressure and early-finish examples because the model must respect both ceiling and fragility.
- Grappler path: takedown entries, control time, opponent get-up rate, and submission exposure.
- Striker path: knockdown power, defensive responsibility, five-round cardio, and judging volatility.
- Market trigger: weigh-in misses, short-notice replacements, and camp-change rumors deserve their own line-move tag.
- Prop filter: finish props need a different threshold from moneyline bets because time and method matter.
UFC update rules
Do not freeze a UFC take before weigh-ins. A bad cut, opponent change, missed limit, or short-notice travel spot can rewrite both the win probability and the finish probability. Keep the modeling workflow tied to fight-night modeling and review the price movement through CLV after the close.
Sport-specific model signals
Use names as evidence, not decoration. The useful SEO win is that Josh Allen, Ja'Marr Chase, Bijan Robinson and Puka Nacua and Bears, Chiefs, Bills, Eagles and Lions appear inside decisions, thresholds, and internal links instead of being dumped into a keyword list.
- Prop EV example: Luka Doncic points or PRA at 32.5 should be checked against projected minutes, usage without key teammates, pace, spread, and back-to-back fatigue before price.
- MLB: a Dodgers at Rockies first-five total of 5.5 should account for starter xFIP, K-BB%, handedness, Coors Field run environment, wind, bullpen rest, and umpire zone.
- NHL: a Maple Leafs puck-line price at +160 needs confirmed goalie, 5v5 expected-goal share, special-teams edge, and empty-net probability before the margin bet makes sense.
- UFC: an Islam Makhachev-style grappling favorite needs takedown entries, control time, get-up rate, and submission exposure; an Alex Pereira-style striker needs knockdown equity and round-by-round cardio risk.
- DFS value example: NBA showdown builds need projected minutes, usage, salary, ownership, and late-swap flexibility before a star salary is worth paying.
- Stack example: an NBA same-game entry with Doncic points, teammate assists, and opponent threes needs one coherent pace script instead of three unrelated legs.
The goal is not to mention every star. It is to show how the model changes when the example changes from Doncic to Shohei Ohtani, Igor Shesterkin, Connor McDavid, or Tom Aspinall. Revisit and update the board when lineups, minutes, starters, goalie confirmations, weigh-ins, or market prices change.
Research note board
Use this model-audit board to keep features, validation, and bet sizing from collapsing into one confidence score.
| Model layer | What to inspect | Example input | Downgrade when |
|---|---|---|---|
| Feature | Whether the variable maps to the sport and market | Josh Allen role data or PPR price movement | The feature is a proxy for something you can measure directly |
| Validation | Out-of-sample error, CLV, calibration, missing data | Bears market movement after injury news | Wins come without beating the close or improving calibration |
| Sizing | Bankroll, confidence interval, correlation, market limit | keeper exposure compared with related tickets | Multiple bets repeat the same thesis at full stake |
Prop OVER hit rate vs line distance from median
Empirical hit rate of OVER bets as the prop line moves away from the player projection median, measured in standard deviations. A line set 1sd below the median hits ~84% of the time — but books price the juice to match.
Breakeven win % at common American odds
The win rate you need to break even at each price. Pick odds shorter than -150 and you must win >60% just to stay flat — a hurdle most casual handicappers never sustain.