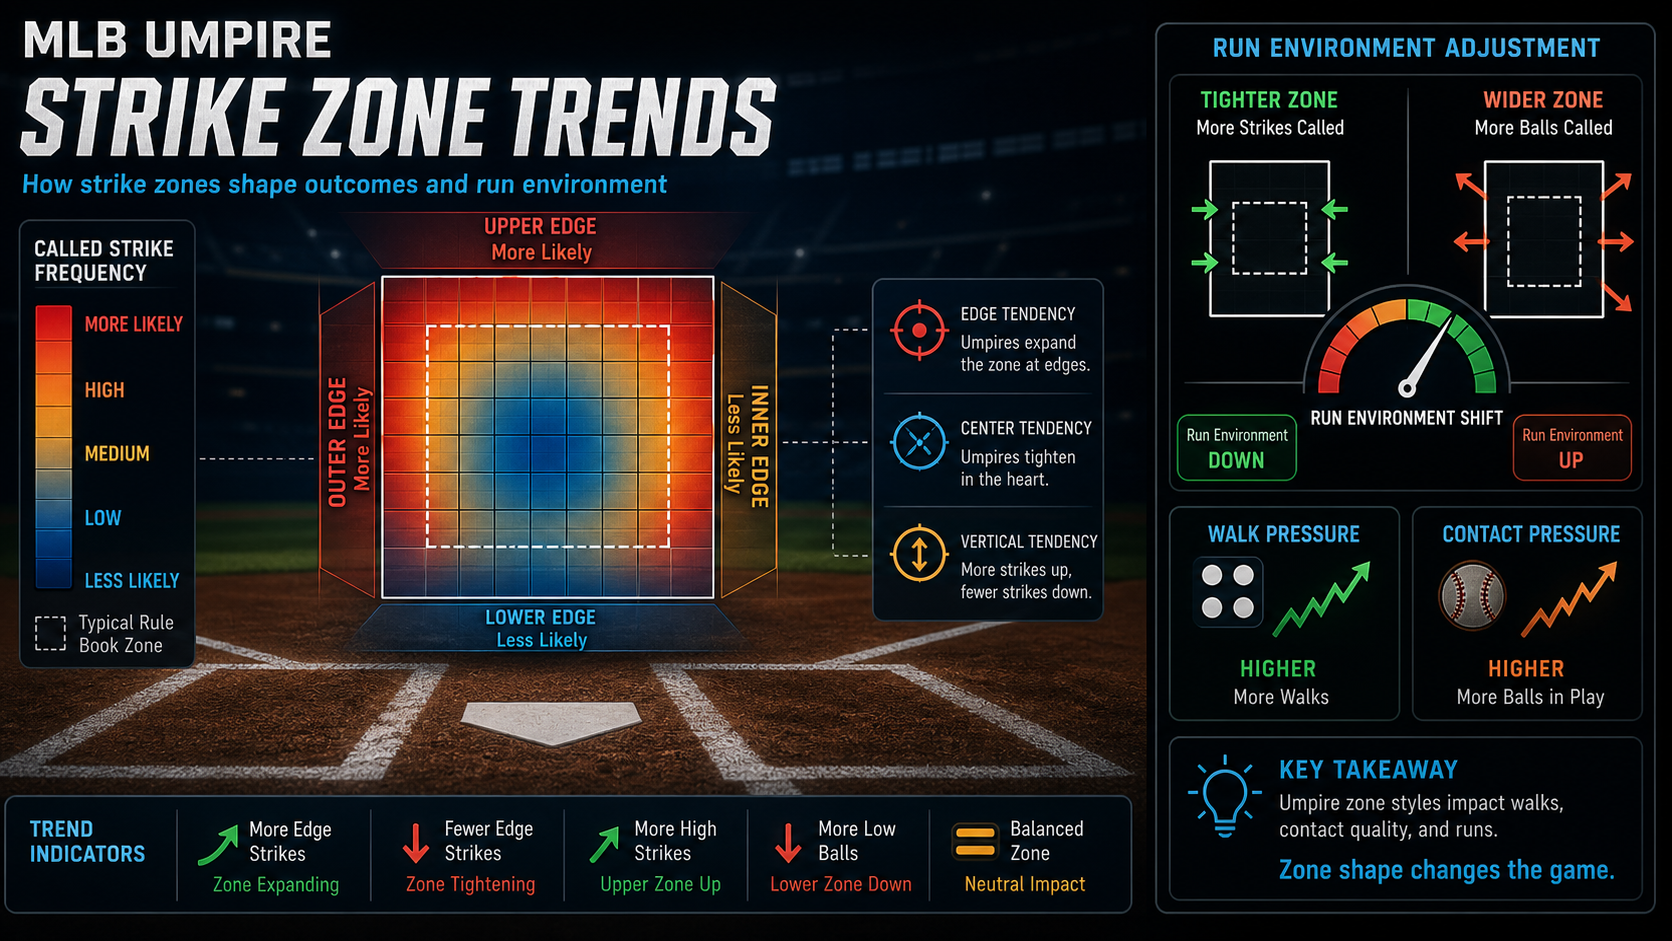
The home plate umpire is the only player on the field who calls his own game without a video review. He decides the strike zone, and the strike zone decides everything else — strikeouts, walks, pitch counts, runs, totals. A "big zone" umpire shifts the average MLB total by roughly a quarter to a half run versus a "small zone" umpire. Books know this, but the line still moves slower than the underlying data, especially on day games and bullpen days. This guide walks through how umpire zones differ, how to read the public stats, and where the betting edge actually lives.
What "umpire zone" actually means
Every pitch is tracked by Statcast. For each call, you can ask: did the umpire follow the rulebook strike zone, or did he expand or contract it? Aggregated across thousands of pitches, you get an umpire's called strike rate on borderline pitches and his strikeout-walk impact versus the average umpire.
Concrete metrics worth tracking:
- K/9 above average: on average, this umpire produces +X strikeouts per 9 innings versus the league baseline.
- BB/9 above average: this umpire produces -Y walks per 9.
- Run impact: the net effect of the K/BB shift on expected runs scored, usually expressed as runs per 9.
The most extreme MLB umpires move expected runs by 0.4 to 0.6 R/9. The mid-tier umpires drift by 0.1 to 0.2. The crew chief might be on either end of the distribution, and the rotating home-plate umpire changes every game.
How umpires shift totals
Consider an MLB total of 8.5 with both pitchers ranked above average. Now look at the home-plate umpire assignment:
- "Big zone" umpire (top quartile): +0.4 K/9, -0.2 BB/9, run impact roughly -0.35 R/9. Expected total drops to ~8.15.
- "Small zone" umpire (bottom quartile): -0.3 K/9, +0.4 BB/9, run impact roughly +0.40 R/9. Expected total rises to ~8.9.
That is a 0.75-run swing on the same matchup based on a single roster decision the bettor can know hours in advance. Yet many books leave the total where it would be without the umpire signal, especially during the early-season grind when the assignments aren't pulled into pricing models.
A worked example
Take a midweek Astros at Mariners game.
- Probables: Verlander vs Castillo
- Posted total: 7.5
- Park factor (T-Mobile): -0.3 R/9 vs neutral
- Expected total without umpire: ~7.4
- Umpire assigned: Angel Hernandez (historically -0.2 K/9, +0.3 BB/9, run impact ~+0.30)
- Adjusted expected total: ~7.7
The book has the line at 7.5. Your model — ump-adjusted — has it at 7.7. That is a 0.2-run edge to the over. After devigging, that's roughly a 4 to 6 percent edge, which is meaningful in a market that typically holds at 4 to 5 percent.
Now flip the example. Same game, same probables, but with a known big-zone umpire whose run impact is -0.35. Adjusted total: 7.05. Book has 7.5. Edge to the under, similar magnitude.
The data sources
The information is public. The plate umpire is announced 30 to 60 minutes before first pitch by MLB. Historical umpire stats are available from Statcast and several umpire-tracking sites. The bettors with the edge build a long-window K/BB/run-impact prior for every active umpire and refresh it once a year (samples are large enough that within-season drift is small).
Two practical traps:
- Confirmation bias on famous umpires. Angel Hernandez and CB Bucknor get tweeted about constantly, but their run-impact numbers are not always the most extreme. The math has to come from the data, not from memory.
- Sample size. A rookie umpire with 30 games is not predictive. Use season-plus career averages and weight by sample.
Markets the umpire signal moves
- Game total over/under. The headline market.
- F5 (first 5 innings) total. Sometimes mispriced more than the full-game total because books focus less here.
- Pitcher strikeout props. Big zone = more Ks. Small zone = fewer. The Ks-prop market is the cleanest expression of the umpire signal because it isolates the direct effect.
- Pitcher BB props. Same logic, opposite direction. Less liquid, larger holds, but real edge.
- Team total totals. If both starters are similar quality, the umpire shifts both team totals symmetrically.
You can see umpire-tagged MLB lines and prop edges on the MLB picks dashboard. Public model accountability and head-to-head closing-line-value comparisons on umpire-aware MLB models live on the model leaderboards.
Why the edge persists
Three structural reasons:
- Late assignment. Umpire crews are announced for series, but home-plate rotation within the series is sometimes only firm hours before. Books that auto-bake the umpire feature run nightly; humans verifying it can lag.
- Public skews to overs. Public bettors hammer overs in MLB. Big-zone unders sit longer than they should because the public is on the over.
- Prop liquidity. Pitcher Ks props are mid-tier liquid. They move on injury news and weather but not always on umpire news, especially at retail books.
Building it into a model
The cleanest implementation: ump-adjusted run-impact as a feature in your totals model and a K-rate adjustment in your pitcher props model. The feature is simple — career K/9 and BB/9 above average for the assigned umpire, multiplied by a regression coefficient your backtest finds.
You can add it as a feature artifact in the Workshop and validate the lift on backtests. Most users find it adds 1 to 3 percent ROI on MLB totals models when properly weighted, and 3 to 6 percent on Ks-prop models. From there, head to Build → New model to drop the umpire feature into a full MLB totals or pitcher-strikeout artifact and ship it to the public leaderboard.
For the broader MLB methodology, see our first-five-innings edge piece, which compounds well with umpire signal. The companion piece on starting pitcher betting is the second half of the same equation — the pitcher sets the upside, the umpire shapes the realised distribution.
Common misuses
- Treating umpire effect as decisive on its own. A 0.3 R/9 swing is meaningful but it is one of many features. Stack it with park, weather, bullpen, and pitcher form.
- Using single-season samples for veteran umps. Career data is way more stable.
- Ignoring catcher framing. A great framing catcher can flip a small-zone umpire's effective zone — model both.
- Sizing too aggressively. The signal is real but small per game. Standard 1-unit sizing applies.
Process: a checklist before betting an MLB total
- Confirm tonight's home-plate umpire (announced 1 hour before first pitch).
- Pull career K/9, BB/9, and run-impact above average.
- Adjust your expected total by the run-impact feature.
- Compare adjusted total vs the posted line.
- If you are betting Ks props, apply the K/9 swing directly to each starter's projected Ks.
- Cross-check with framing-quality of the catchers — they amplify or dampen the umpire's zone.
Three umpire archetypes you will see all season
Most umpires sit close to league average, but the long tails are where the bet lives. Three archetypes recur often enough to memorise:
- The "low zone" pitcher caller. Heavy bottom-of-zone calls, modest top expansion. Runs slightly low on K/9, slightly low on BB/9, near-zero net run-impact. Useful as a sinker-pitcher signal even when totals don't move — sinker-heavy starters get extra ground balls in front of this umpire and the team-total under for their opponents firms up.
- The "expand-everywhere" big zone. Top quartile in K/9 and bottom quartile in BB/9. Net run-impact often -0.30 to -0.50 R/9. The headline target for under bettors. Confirm the catcher pair before betting — two below-average framers paired with this ump produce a slightly diluted version.
- The "tight squeeze" small zone. Bottom quartile K/9, top quartile BB/9. Run-impact +0.30 to +0.45 R/9. Best target for over bettors, K-prop unders on both starters, and walk-prop overs. The market is usually slowest to adjust pitcher BB props for this archetype because the BB-prop market itself is illiquid.
Sample-week worked process
An actual modeling workflow during a midweek MLB slate:
- Pull the home-plate umpire for every game on the slate from the published rotation (45 minutes pre-first-pitch on the latest games).
- Look up career K/9, BB/9, and run-impact above average for each ump. Regress rookie umps to league average.
- Apply the run-impact as a feature in the totals model. Adjusted total = base total + run-impact above average.
- Apply the K/9 adjustment to each starting pitcher''s projected Ks. Adjusted Ks = base projection + (K/9 above average × innings projected / 9).
- Compare adjusted total vs posted line for each game. Flag any game where the adjustment crosses a key number (7.0, 7.5, 8.0, 8.5, 9.0).
- For K props, flag any starter whose adjusted Ks differs from posted prop by more than 0.5.
- Size bets by edge. Don''t flat-bet — the umpire-driven edge is small per game and compounds via volume.
The DFS overlay
Umpire effects show up in DFS contests too. Big-zone umps depress hitter scoring across the slate (more Ks, fewer plate appearances reaching contact). DFS lineups that overweight hitters in big-zone games take a small but persistent hit. The Gridiron contest hub shows how the field is positioned on a given slate — when the field is overweighted to the team facing a known big-zone ump, fading into a pitcher stack or the opposing pitcher prop has correlated leverage with the underlying market signal.
Marketplace models that already encode this
Search the model marketplace for "umpire-adjusted MLB" templates. Several public Tinker-published models include an umpire feature artifact you can fork directly. The closing-line-value column on the marketplace tells you which ones actually beat the close — that filter is the fastest way to find a usable starting point without writing the umpire layer from scratch.
Bottom line
The plate umpire is one of the highest-information features in MLB betting and one of the lowest-priced ones. A 0.3 to 0.5 R/9 swing in expected runs from the umpire alone is enough to flip plenty of marginal totals plays, and Ks props move even more directly. The data is free, the assignments are public, and the books that bake it in fastest still leave plenty of edge for bettors who do the work. Start by tagging the next 50 MLB totals you grade with the home-plate ump''s run-impact and see how often the line lags the signal — you will be surprised.
Bet responsibly — set limits, never chase losses.
MLB example board
A baseball betting read needs names because starter, lineup, park, and umpire inputs can move the number before the public sees the reason. Shohei Ohtani, Aaron Judge, and Juan Soto are clean examples for lineup gravity because one premium bat can alter run expectancy, opposing bullpen choices, and same-game prop pricing. Tarik Skubal and Spencer Strider are starter examples where strikeout ceiling, pitch count, and opponent handedness can matter more than the season-long team record.
- First five innings: isolate the starter matchup before bullpen quality muddies the handicap.
- Starter scratch: separate true downgrade from book cleanup after the market overreacts.
- Park factor: Coors Field, Camden Yards, and Petco Park should not be treated like the same run environment.
- Lineup news: Ohtani, Judge, or Soto availability can move both full-game totals and hitter props.
MLB update rules
The article should be updated when a confirmed lineup, starter change, roof status, umpire assignment, or weather shift changes the edge. For related workflows, use MLB first-five betting and closing-line value to decide whether the move created value or simply erased it.
Sport-specific model signals
Use names as evidence, not decoration. The useful SEO win is that Josh Allen, Ja'Marr Chase, Bijan Robinson and Puka Nacua and Chiefs, Bills, Eagles and Lions appear inside decisions, thresholds, and internal links instead of being dumped into a keyword list.
- Prop EV example: Luka Doncic points or PRA at 32.5 should be checked against projected minutes, usage without key teammates, pace, spread, and back-to-back fatigue before price.
- MLB: a Dodgers at Rockies first-five total of 5.5 should account for starter xFIP, K-BB%, handedness, Coors Field run environment, wind, bullpen rest, and umpire zone.
- NHL: a Maple Leafs puck-line price at +160 needs confirmed goalie, 5v5 expected-goal share, special-teams edge, and empty-net probability before the margin bet makes sense.
- UFC: an Islam Makhachev-style grappling favorite needs takedown entries, control time, get-up rate, and submission exposure; an Alex Pereira-style striker needs knockdown equity and round-by-round cardio risk.
- DFS value example: NBA showdown builds need projected minutes, usage, salary, ownership, and late-swap flexibility before a star salary is worth paying.
- Stack example: an NBA same-game entry with Doncic points, teammate assists, and opponent threes needs one coherent pace script instead of three unrelated legs.
The goal is not to mention every star. It is to show how the model changes when the example changes from Doncic to Shohei Ohtani, Igor Shesterkin, Connor McDavid, or Tom Aspinall. Revisit and update the board when lineups, minutes, starters, goalie confirmations, weigh-ins, or market prices change.
Research note board
Use this table to turn the guide into a decision note. The point is to know when the idea is actionable and when it is only context.
| Angle | Input to verify | Example application | Pass when |
|---|---|---|---|
| Market price | Spread, total, moneyline, prop price, or futures hold | Chiefs and Bills compared through vig | The price has moved past the number that created the edge |
| Football or sport context | Role, pace, weather, injury status, opponent style | Josh Allen role news mapped to the relevant market | The original input changes or remains unconfirmed |
| Review loop | Entry, close, result, and reason code | hold logged with a clear thesis | You cannot explain whether the process beat the market |
EV per $100 across win rate × odds grid
Expected value of a $100 stake at each combination of true win rate and market odds. Anywhere the cell is positive you have a long-run profitable bet; the magnitude shows how aggressive Kelly will size it.
Average total points by weather bucket
Average combined points scored in NFL games by weather bucket over recent seasons. Wind above 20mph and snow each clip totals by 6-8 points vs domed games, which is why books move totals aggressively when forecasts shift.