Win-loss record is the noisiest metric in sports betting. You can hit 60 percent over a month and still be a losing bettor in the long run, or hit 48 percent and be a clear winner. The signal that cuts through the variance is closing line value — CLV. If you consistently beat the closing line, you will profit. If you do not, you will not. This guide explains what CLV is, why it matters more than your record, and how to track it on every bet you place.
What closing line value is
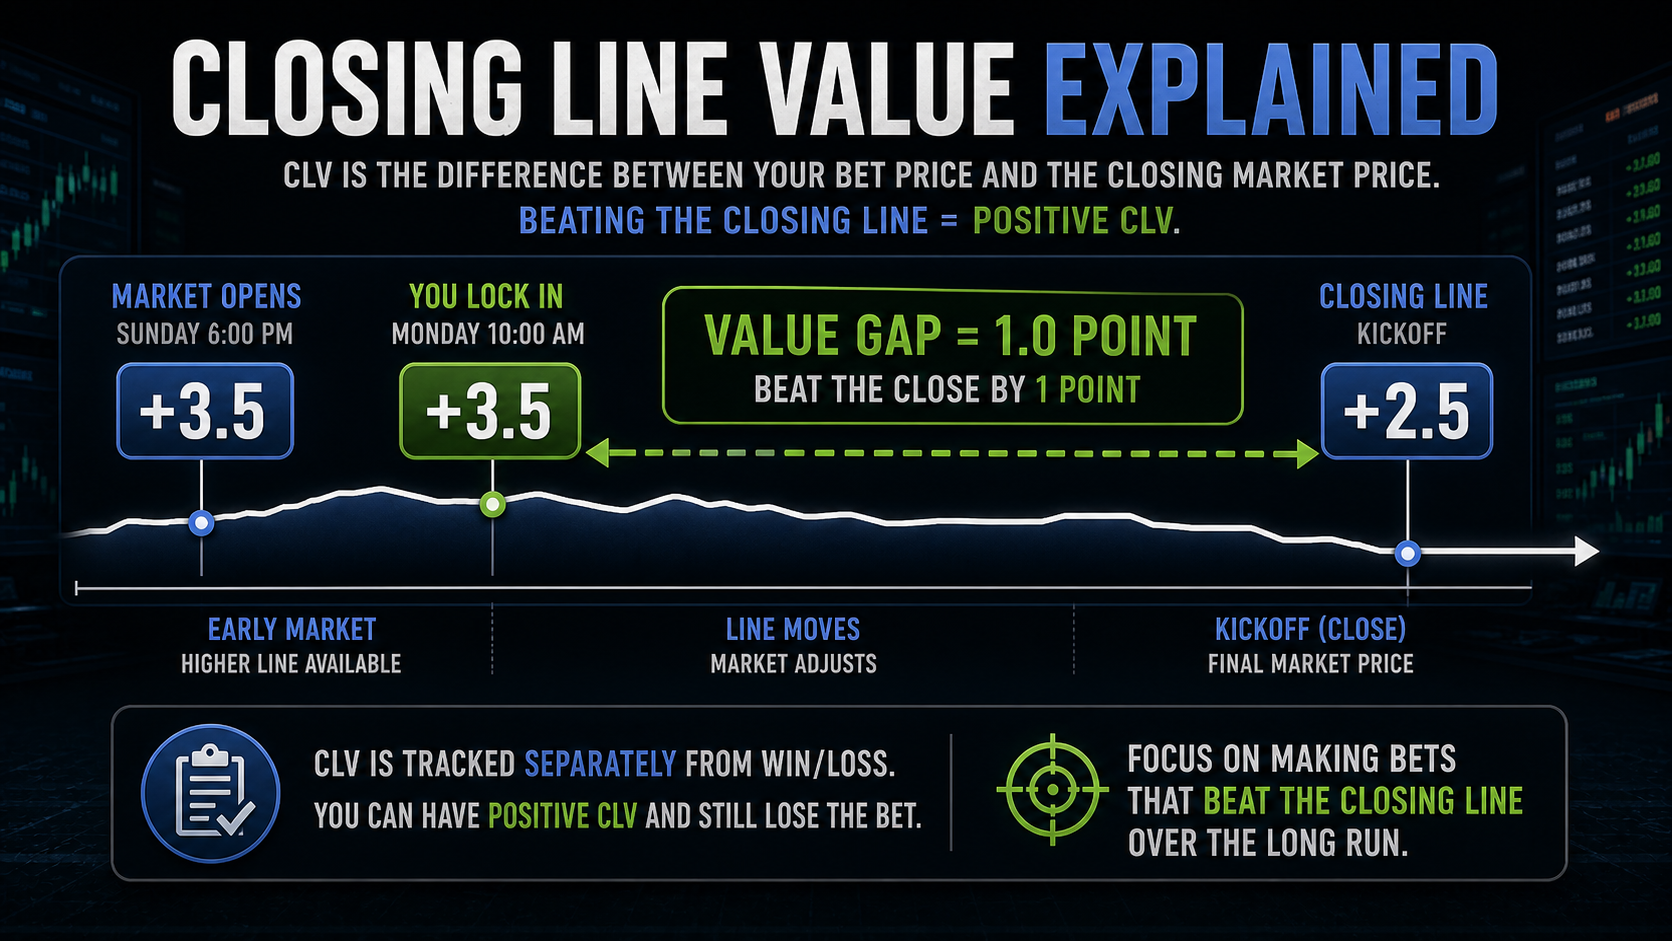
The closing line is the final price a market posts before kickoff. It is the most accurate prediction the market produces — every piece of public information, every sharp wager, every late injury report has already been priced in. Closing-line value measures how much better your bet was than the closing price.
If you bet the Eagles at +3.5 (-110) against the Cowboys and the line closes at Eagles +2.5 (-110), you got a full point of CLV. The market eventually agreed your side was the right one — you just got there first.
Why the closing line is the benchmark
Decades of academic and practitioner data show the closing line in major sports markets is a near-efficient predictor. The closing spread predicts game outcome better than any single model, because it aggregates every model. Beating that number means your wager carried information the market had not fully priced when you placed it.
Why CLV beats win rate
Imagine two bettors over the same 100 NFL games:
- Bettor A goes 55-45 (55 percent win rate). Average CLV: -0.8 points.
- Bettor B goes 49-51 (49 percent win rate). Average CLV: +1.4 points.
Bettor A looks like a winner on paper but is bleeding money long-term — they are getting worse prices than the closing line, meaning their wagers were on the wrong side of the information curve. Bettor B looks unlucky but is making positive expected-value bets on every wager. Run another 1,000 games and Bettor B will pull ahead by tens of thousands of dollars.
Variance dominates short samples. CLV is signal. Win rate is noise stacked on top of signal.
Want to measure your own season-long CLV variance? The CLV tracking guide ships with a live calculator that runs a 200-pick distribution at your average CLV and shows how many cold streaks you'd have to swim through to see the signal.
How to calculate CLV
For point spreads and totals, CLV is measured in points and converted to expected value. For moneylines, CLV is measured in implied probability difference.
Spread/total CLV
- Record the line at the time you bet (e.g. -3.5).
- Record the closing line (e.g. -2.5).
- Difference is +1 point in your favor.
- Each half-point near key numbers (3, 7) is worth roughly 2.5–4 percent of expected value. Away from key numbers, closer to 1.5 percent. We cover why those numbers matter in the NFL spreads guide.
Moneyline CLV
- Convert your odds and the closing odds to implied probability.
- Bet at +150 (40.0 percent), closes at +130 (43.5 percent). Your CLV is +3.5 percentage points.
- That is the EV your wager carried at the moment of execution.
A concrete example
You bet Bills -3 (-110) on Wednesday morning after your injury read says Josh Allen is healthier than the market assumes. By Sunday kickoff, the line has moved to Bills -5 (-115). You captured 2 points of CLV — a huge result, especially crossing the key number 3.
- Going from 3 to 5 crosses both a half-point hook and the key number 3 itself.
- Estimated EV gain: 7–8 percent on the wager.
Even if the Bills lose outright, that bet was a good bet. Make 100 bets like that and the math works in your favor regardless of any individual outcome.
Tracking CLV on every wager
Habit is everything. Every time you place a bet, log:
- Date, sport, market, side, line, and price at execution.
- Closing line and price.
- CLV in points (spread/total) or probability (moneyline).
After 200 bets, your average CLV will tell you whether you have an edge. Average CLV under -0.5 points means you are a losing bettor regardless of recent results. Average CLV over +0.3 points means you are a long-term winner regardless of a recent cold streak. The column setup in our bet-tracking guide is the easiest way to audit this. You can also track CLV against published model lines on our model leaderboards, or build a model in the lab and evaluate its closing-line tracking before staking real money.
CLV traps and caveats
Steam-chasing is not CLV
Following sharp moves after they happen does not generate CLV. By the time the line moved, the value is gone. Real CLV comes from being on the right side before the move.
Soft books vs sharp books
If you bet at a soft book that is slow to react, your CLV measurement should compare against a sharp book's closer (Pinnacle, Circa, BetCRIS) — not the soft book's own line. Otherwise you are measuring against a stale benchmark.
Limits matter
Hitting +2 CLV on $50 wagers at a recreational book is great as proof of concept, but real money requires books that take real action. CLV at small limits often does not survive at sharp limits, where the closing line gets harder to beat.
Using CLV to evaluate models
Every prediction your model spits out can be back-tested against the closing line. Did your model find +2 average CLV over 500 bets? You have an edge. Did it find -0.4 average CLV? It is losing to the market — go back to features and rerun. CLV is the cleanest validation signal a model has, far better than win rate or ROI on a small sample. Browse model CLV stats on our NFL picks page to see what disciplined models look like in production, and prototype refinements on the model workshop before deploying.
CLV across markets: where the math changes
Average-CLV thresholds are not the same for every market type. The hold structure of the market sets the floor:
- NFL spreads (-110 / -110, ~4.5 percent hold): +0.3 points avg CLV is roughly break-even after juice. +0.5 is solidly profitable.
- NBA totals (-110 / -110): similar. CLV measured in points; same +0.3 threshold.
- Moneylines: measure in implied probability. Break-even threshold around +1.5 percent average; +3 percent is sharp.
- Player props (~7 percent hold): the higher juice means the CLV bar is higher too — plan for +0.7 to +1.0 points to clear vig and produce real profit.
- SGPs and futures (15 to 25 percent hold): CLV is harder to measure cleanly because comparison lines are sparse. Most disciplined bettors avoid these or treat them as recreational entertainment.
The implication: average CLV is not a single number. Track it per market type and compare each slice against the appropriate threshold.
How CLV behaves through the betting cycle
The easiest CLV often comes early in the betting cycle, when the market has not yet absorbed all the information that will hit before kickoff. Examples:
- Monday-after-game NFL openers are softer than Sunday-morning closing lines. Sharp players exploit this.
- Injury news that drops Friday afternoon resets prices. Bets placed before the news but on the right side capture the move.
- Weather forecasts firming up in outdoor sports — totals especially — produce predictable closing-line drift.
- Lineup announcements in NBA and MLB swing player props and game totals; pricing 30 minutes before lock often shows the biggest gap to closing line.
None of these guarantee CLV — they create the conditions for it. The bettor still has to be on the right side. But the timing windows are real and worth scheduling around.
Common CLV-tracking failures
- Using your own book's close instead of a sharp close. Soft books move late and slowly. Measure against Pinnacle or Circa where possible.
- Forgetting to log losing bets' CLV. The losing-bet CLV is the same signal as the winning-bet CLV. Selective logging corrupts the average.
- Aggregating across markets. Average CLV across NFL spreads, NBA props, and MLB run lines does not mean anything because each market has its own break-even threshold.
- Measuring against the wrong line type. A first-half spread should be measured against the first-half closing line, not the full-game close.
- Underestimating the cost of stale lines. If you take 15 minutes to enter a bet and the price drifts in your favor during entry, you have not captured CLV — you just got the new price. Log the price you executed at, not the screen price 10 minutes earlier.
CLV in tournament and contest play
Outside of traditional sportsbooks, CLV concepts still apply. DFS contest lineups can be evaluated against the closing ownership-weighted optimal lineup. Prediction markets settle against a final price you can compare to entry. Tournament brackets on the gridiron page and cards minted on the marketplace can be back-evaluated against final settlement prices to compute the equivalent of CLV for those formats. The principle is the same: did your entry beat the sharpest available consensus at the moment of execution? If yes, the process is sound.
Sample size: how much is enough?
Variance in win rate calms down slowly. To distinguish a 53 percent winner from a 50 percent breakeven bettor at 95 percent confidence, you need roughly 1,000 bets. CLV converges much faster — even 100 wagers give you a meaningful estimate of your average edge. That speed advantage is the practical reason CLV beats record as a self-evaluation tool. You can stop second-guessing your strategy after a hundred wagers instead of waiting half a season.
A full 2026-season CLV workflow
Concrete walkthrough on a real-style slate. Tuesday morning, the market opens the Chiefs at -6.5 (-110) vs Bengals for Sunday Night Football. Your model says Chiefs cover 55%. Implied at -110 is 52.4%. You take the bet.
- Tuesday open: Chiefs -6.5 (-110). You bet $300 to win $272.
- Wednesday: Travis Kelce questionable with knee. Line moves to -6 (-115). You did not lose value — the move was in your favor.
- Thursday: Kelce upgraded to probable. Line moves to -7 (-110), crossing the key number 7.
- Sunday close: Chiefs -7.5 (-110). Your CLV is +1 point of spread plus the favorable crossing of the 7 key number.
That bet was a winner before the game started. Estimated EV gain from CLV alone: 5-6% on the wager, plus a 2-3% bonus from crossing the 7. If the Chiefs cover 7.5, you cash and the CLV confirmed the read. If they lose by 8, you push, but the bet was still mathematically correct. If they lose outright, you lose — but make 200 of those bets and the math is overwhelmingly positive.
What happens when CLV diverges from your record
Three patterns to watch for in your 200-bet sample. First, positive CLV with negative record — keep betting. You are unlucky, not wrong. The sample will revert. Second, negative CLV with positive record — stop and re-examine the model. You are lucky, not skilled, and the regression is coming. Third, positive CLV with positive record — scale up cautiously. Move from quarter Kelly to half Kelly per the Kelly Criterion guide, but only after another 200-bet confirmation window. The fastest way to give back CLV-driven gains is to ramp stakes the day you notice them.
Tools to track CLV automatically
Manual CLV logging breaks down at scale. After 50 bets per week, copying lines from sportsbook screenshots into a spreadsheet is a chore that gets skipped. Three tooling approaches that survive:
- Builder workflow: spin up a tracking surface in the builder with a CLV column that pulls the closing line from your model's reference book at kickoff. Every bet you log gets CLV calculated automatically.
- Picks-page integration: any bet you place from the picks feed auto-logs the entry line and pulls the closer at game time. Average CLV across the past 30, 60, and 90 days is visible on a single dashboard.
- Workshop replay: the workshop lets you re-run any historical bet sample against a hypothetical model to see whether the model would have produced CLV-positive bets on past slates. Useful for evaluating a candidate model before deploying real money.
The point of automation is not laziness — it is consistency. CLV is only useful as a self-eval metric if you measure it on every bet, including the ones you hate logging. Automation removes the selection bias.
CLV across sports
NBA totals — fast convergence
NBA totals close extremely sharp because the market trades on injury news and pace estimates that all hit before tip. CLV in NBA totals is hard to manufacture without an information edge (early lineup leaks, referee assignment context). Average CLV above +1 point in NBA totals over 200 bets is rare and usually indicates a genuine repeatable edge.
MLB run lines — wider variance
MLB lines move on starting pitcher confirmations and weather, both of which are public information. CLV in MLB is more capturable through fast reads on weather (wind in/wind out of Coors and Wrigley) and on bullpen usage. Average CLV of +5 cents on moneyline or +0.3 on run line is achievable for a disciplined bettor.
UFC and PrizePicks pickem — different math entirely
UFC fights and pickem products do not have traditional closing lines. UFC fights close at the moneyline minutes before walkout; CLV is measurable but slow. PrizePicks and similar parimutuel products do not move lines, so CLV is replaced by edge-vs-payout-schedule. The pickem version of CLV is "what was the consensus probability at lock vs my model's probability." Worth tracking, but mechanically different from spread-CLV.
Bottom line
Closing line value is the single most predictive metric in sports betting. A losing month with positive CLV means you are a winner who got unlucky. A winning month with negative CLV means you are a loser who got lucky. Track it on every bet, focus your improvement on raising your CLV average, and the win rate takes care of itself over a large enough sample.
Pair the CLV habit with the column setup in the bet-tracking guide, the sizing framework in the Kelly Criterion explainer, and clean reads on vig and hold so the edge survives the tax. The four metrics together form the math layer underneath every long-term winning bettor.
Bet responsibly — set limits, never chase losses.
Model inputs worth naming
Use names as evidence, not decoration. The useful SEO win is that Josh Allen, Travis Kelce, Ja'Marr Chase, Bijan Robinson and Puka Nacua and Chiefs, Bills, Eagles, Bengals and Cowboys appear inside decisions, thresholds, and internal links instead of being dumped into a keyword list.
- NFL model: route participation for Ja'Marr Chase, rushing attempts for Josh Allen, pressure rate allowed by the Bengals, and red-zone carry share for Jonathan Taylor should be separate features.
- NBA model: usage, projected minutes, rest, and pace should move Nikola Jokic or Shai Gilgeous-Alexander props differently than a one-number power rating.
- MLB model: Tarik Skubal strikeout projection, Coors Field park factor, lineup confirmation, and bullpen rest need their own columns.
- Review loop: grade entry price, closing price, bet result, and model error separately so lucky results do not hide bad forecasts.
Build or audit the workflow in Tinker and review it with CLV.
Research note board
Use this model-audit board to keep features, validation, and bet sizing from collapsing into one confidence score.
| Model layer | What to inspect | Example input | Downgrade when |
|---|---|---|---|
| Feature | Whether the variable maps to the sport and market | Josh Allen role data or PPR price movement | The feature is a proxy for something you can measure directly |
| Validation | Out-of-sample error, CLV, calibration, missing data | Chiefs market movement after injury news | Wins come without beating the close or improving calibration |
| Sizing | Bankroll, confidence interval, correlation, market limit | closing line value exposure compared with related tickets | Multiple bets repeat the same thesis at full stake |
Model calibration: predicted vs observed
Predicted win probability bucket vs the empirical win rate inside that bucket on the test set. Points on the y=x reference line are perfectly calibrated; points below mean the model is overconfident in that bucket.
EV per $100 across win rate × odds grid
Expected value of a $100 stake at each combination of true win rate and market odds. Anywhere the cell is positive you have a long-run profitable bet; the magnitude shows how aggressive Kelly will size it.