If you do not track your bets, you do not know whether you are good. You have a story you tell yourself, and that story is almost always wrong. Memory inflates wins and discounts losses. The bet you "knew" was a lock you forgot about until you hit it. The 0-4 Sunday gets blamed on bad luck instead of bad lines. A spreadsheet does what your brain refuses to do: it tells you the truth. This guide walks through the columns every bettor's log needs, the metrics it should compute automatically, and the mistakes that make most bet logs useless.
Why tracking matters more than you think
Casinos run on the assumption that the average customer cannot tell whether they are winning. That assumption is correct for the average sports bettor too. Without a log:
- You will overrate your favorite sport and team because winners are sticky in memory.
- You will underestimate parlay losses because they happen quietly.
- You will not know if your edge is real or a hot streak.
- You cannot adjust unit size, fade weak markets, or double down on real edges — because you do not know which is which.
Tracking is not about discipline for discipline's sake. It is the data that makes every other improvement possible.
The columns every bet log needs
You can use Google Sheets, Excel, Notion, or a paid app — what matters is the columns. The minimum useful schema:
- Date — when the bet was placed (not the game date)
- Sport — NFL, NBA, MLB, NHL, soccer, MMA, etc.
- Market — spread, total, moneyline, player prop, parlay, futures
- Selection — what you actually bet (e.g., "Bills -3.5", "Justin Jefferson over 82.5 receiving yards")
- Line/Odds — the price you got
- Closing line — the line at game start (critical, do not skip)
- Stake (units) — in units, not just dollars
- Stake ($) — actual dollar amount
- Result — win/loss/push
- Profit/loss ($)
- Source — model, tout, gut, friend
- Notes — weather, injuries, why you played
Without the closing line, the log is decorative. With it, you can answer the only question that matters: am I beating the close?
Closing line value (CLV): the metric that decides everything
The closing line is the sharpest version of the line — every piece of information that hits the market is in there. If you consistently beat the close, you are getting better prices than the market consensus, which is a strong leading indicator that you are a long-term winner. If you consistently lose to the close, you are paying a tax on every bet, edge or not.
Example: you bet Eagles -3 (-110) against the Cowboys after your number has Philadelphia -4. The line closes at Eagles -3.5 (-110). You beat the close. Even if the Eagles lose by 4 and you lose this bet, your process got you a better number than the market settled on, and over hundreds of bets that translates to profit. The deeper version is our CLV explainer.
Two ways to express CLV:
- Points beaten: simple subtraction. You took -3, line closed -3.5, you beat by 0.5 points.
- EV beaten: implied probability of your line minus implied probability of the close, devigged. Slightly more accurate, especially on moneylines.
Logging both lines and the difference is the highest-leverage two cells in your spreadsheet.
The metrics your spreadsheet should compute automatically
- Total bets by sport, market, and source
- Win rate by category
- ROI = total profit / total amount risked
- Units won/lost
- Average CLV by sport and market
- Performance vs unit size — do your one-unit plays beat your two-unit plays?
- Bet count by stake size — are you flat betting like you think you are?
If your tracker does not compute these, it is a list, not a tool.
A worked monthly readout
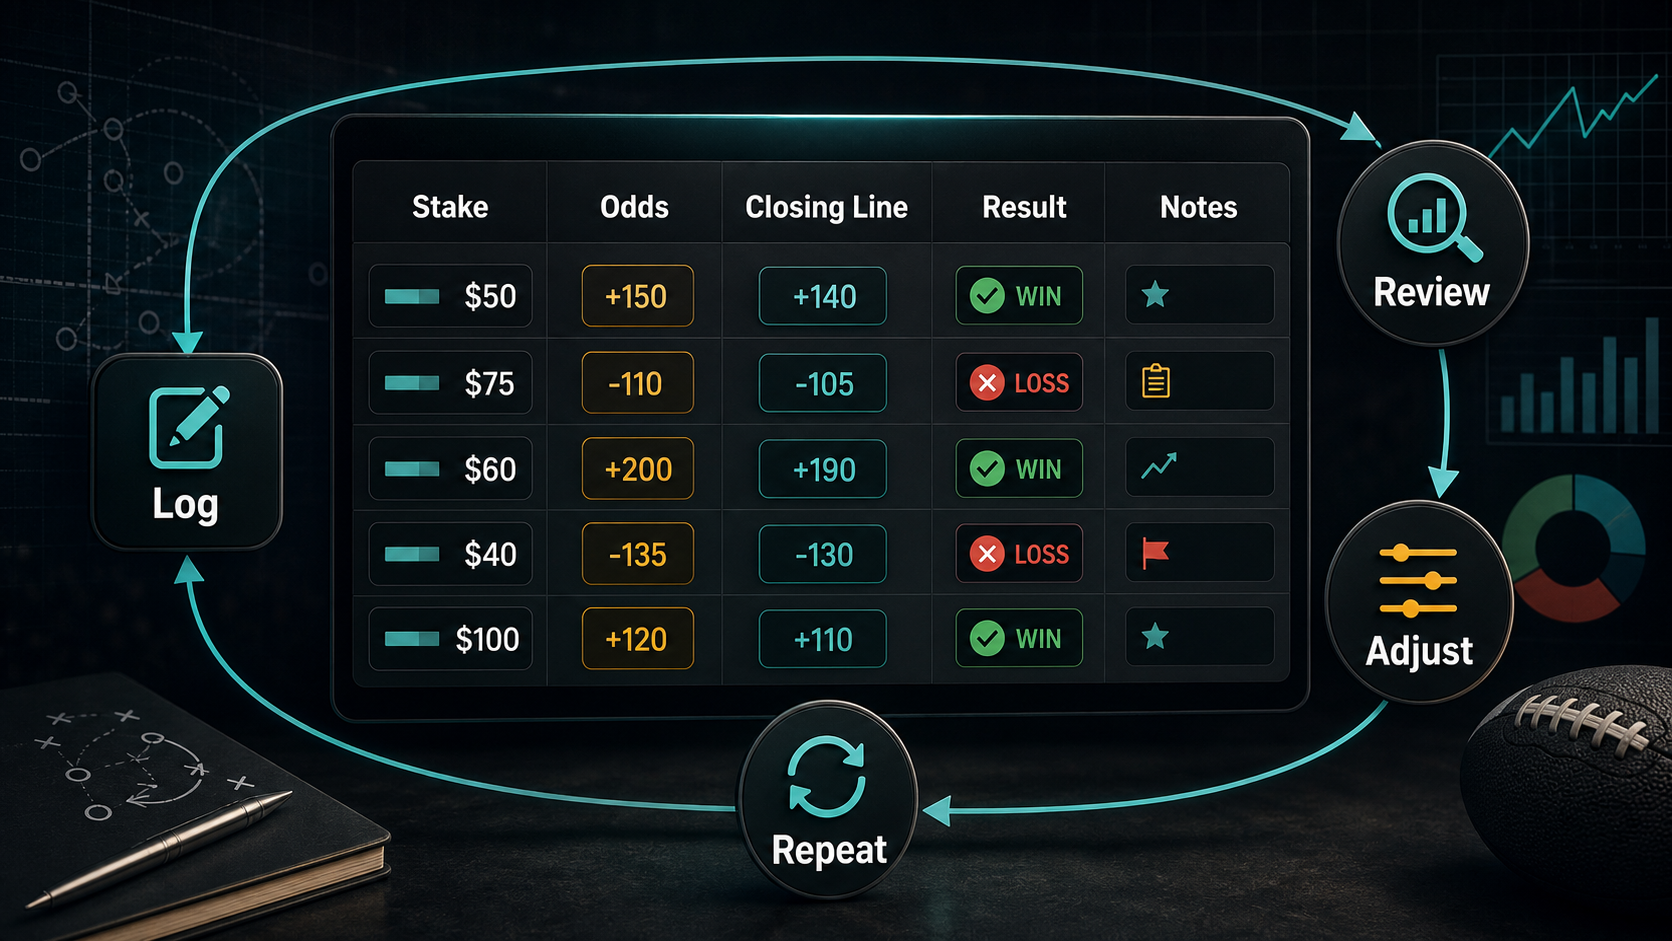
After a 100-bet month, your sheet might say:
- Bets: 100
- Risked: $2,000
- Profit: +$140
- ROI: 7.0%
- Win rate: 56%
- Average CLV: +0.4 points
That is a good month. But the slice that matters: NFL spreads were +0.6 CLV and 60% win rate, with strong prices on Bills, Ravens, and 49ers sides. NBA player props were -0.2 CLV and 49% win rate. The aggregate looks great, but you are bleeding edge on props and printing on spreads. That is the actionable insight a log gives you. Without it, you have "had a decent month."
Building the spreadsheet step by step
If you have never built a betting log, here is the fastest path to something useful:
- One row per bet. Single rows for parlays at minimum; a second sub-table per leg if you want the deeper analysis.
- Drop-down validation on Sport, Market, and Source columns. Free-form entry guarantees typos and breaks pivot tables three months in.
- Stake-in-units formula = stake_dollars / current_bankroll. Hard-code the bankroll number at the top of the sheet and update quarterly.
- CLV columns as both points and devigged probability. Add the implied-probability formula once and reuse it.
- Monthly pivot by sport × market × source with win rate, ROI, average CLV, and bet count.
- Closed-line auto-population if your books have an API. Otherwise, take 5 minutes Monday morning to fill in the prior week's closes from screenshots.
The biggest barrier is not the formulas — it is the discipline of entering bets within an hour of placing them. Skip a few days and the closing-line data is lost forever; trying to backfill from memory is worse than not tracking.
What the data tells you after 100, 500, 1000 bets
Different sample sizes unlock different questions:
- 100 bets. Useful to estimate average CLV per slice. Win rate is mostly noise. Stop here if you want a "is my process roughly working" read.
- 500 bets. CLV is tight enough to act on per-market. You can confidently kill an unprofitable market. Win rate by source is starting to mean something.
- 1,000 bets. Win-rate confidence interval narrows to about ±3 points. You can rank your sources, your books, and your sports. Unit-size scaling decisions can be evidence-based.
- 2,500+ bets. Sub-slice signal (specific market types within sports — props vs spreads within NBA, for instance) becomes reliable. Most bettors never reach this. Those that do compound knowledge fast.
Common slicing dimensions worth tracking
The default monthly pivot is useful. Beyond that, here are slices that consistently surface insights:
- Day of week × sport. Sunday NFL behaves differently than Thursday NFL. Friday NBA spreads behave differently than Tuesday NBA.
- Time before kickoff. Bets placed 24+ hours before kickoff often outperform same-day bets — partly because the early line is softer.
- Underdog vs favorite. Some bettors print on dogs and lose on chalk, or vice versa. A simple side filter exposes that.
- Line buckets. NFL spreads bucketed as 0-3 / 3.5-7 / 7.5-10 / 10+ often produce very different win rates. The buckets near key numbers tend to behave worst because the market knows the keys too.
- Book. Same wager at two books can produce two different CLV readings. Slicing by book tells you who has the sharper price most often.
Building these pivots once is a Saturday afternoon of work. After that, the monthly review takes ten minutes.
Edge cases the spreadsheet has to handle
- Pushes. Log as separate result class, not win or loss. ROI math should exclude pushed stakes from the denominator or treat them as returned capital.
- Half-loss / half-win props. DK and PrizePicks half-payout rules require splitting the bet into two half-stake rows or a dedicated payout-multiplier column.
- Cashed-out bets. Treat as a wager closed at the cash-out price; record both the original line and the closeout. Books rarely give cash-out players good value — the log will tell you exactly how much you are losing to convenience.
- Free-bet payouts. The stake column should reflect actual money risked, not promo value. Mark these in the Source column for separate analysis.
- Voided bets. Exclude entirely from win rate and ROI; keep the row for audit trail.
Common bet log mistakes
- Skipping the closing line. The single most-skipped column, and the only one that proves edge.
- Logging in dollars only. Units make performance comparable across bankroll changes.
- Lumping all parlays into one row. Track each leg separately if possible — it changes which legs are actually profitable.
- Forgetting to log losses. Skipping the ugly ones is the most common form of self-deception.
- Reviewing weekly, sizing daily. Look at the data monthly. Don't tweak unit size after one bad weekend.
Tracking model bets vs gut bets
If you are running models you built in the lab, your model picks are already logged with predicted probability and CLV automatically tracked. The bigger lift is logging your off-model bets — the gut plays, the "I just liked it" wagers, the friend's tip you took. You will almost always discover that your gut bets are dragging your overall numbers down. That data is worth its weight in bankroll.
You can sanity-check your model's calibration directly on the leaderboards before betting it, and browse community-shared tracking snippets on the card marketplace for ideas on slicing your own data.
What to do with the data
After 200 to 500 logged bets, you have enough sample to act. Pair the review with bankroll management so the spreadsheet actually changes future stake sizes:
- If a market category is below water on CLV, stop betting it.
- If your high-confidence plays don't beat your routine plays, go flat-bet.
- If one sportsbook gives consistently better prices, route more action there.
- If you are net positive on CLV but negative on profit, your sample is just too small — keep going.
Bottom line
Tracking your bets is the cheapest, highest-EV thing you can do as a bettor. Build a sheet with the columns above, especially the closing line. Compute ROI, win rate, and CLV by slice. Review monthly, not daily. Log the ugly bets along with the pretty ones, and let the spreadsheet tell you what is and isn't working.
If you'd rather skip the spreadsheet entirely for model bets, the dashboards on NFL picks, NBA picks, and MLB picks already track results, CLV, and ROI per model — and the workshop lets you log custom slices alongside your own model predictions. Pair the tracking habit with a clean read on hold and the sizing rules in the Kelly Criterion guide. The hardest part — being honest with yourself about your numbers — is no longer optional.
Bet responsibly — set limits, never chase losses.
Price examples and pass rules
Use names as evidence, not decoration. The useful SEO win is that Justin Jefferson, Josh Allen, Ja'Marr Chase, Bijan Robinson and Puka Nacua and Bills, Ravens, Eagles, Cowboys and 49ers appear inside decisions, thresholds, and internal links instead of being dumped into a keyword list.
- Spread example: if Chiefs-Broncos opens Chiefs -3.5 and your fair number is -2.8, +3.5 is the bet, +3 is a pass, and the moneyline needs roughly +155 or better before it replaces the spread.
- Total example: if a Bills outdoor total opens 46.5 and wind moves from 8 mph to 21 mph, an under projection at 42.8 still needs a playable number; under 45 or better is different from chasing 43.5.
- Futures example: Bengals AFC North +280 is 26.3% before hold. If your fair number is 30%, stake modestly, track portfolio correlation, and avoid stacking every Burrow, Chase, and Higgins bet into the same thesis.
- CLV rule: a good write-up is not enough. Track whether the spread, total, prop, or futures price closed better than your entry before grading the process.
Use closing-line value guide, vig and hold guide, bet tracking workflow to keep the examples attached to measurable prices.
Research note board
Use this table to turn the guide into a decision note. The point is to know when the idea is actionable and when it is only context.
| Angle | Input to verify | Example application | Pass when |
|---|---|---|---|
| Market price | Spread, total, moneyline, prop price, or futures hold | Bills and Ravens compared through closing line value | The price has moved past the number that created the edge |
| Football or sport context | Role, pace, weather, injury status, opponent style | Justin Jefferson role news mapped to the relevant market | The original input changes or remains unconfirmed |
| Review loop | Entry, close, result, and reason code | CLV logged with a clear thesis | You cannot explain whether the process beat the market |
NFL ATS cover-margin distribution
Distribution of (final margin − closing spread) across an NFL season. Roughly normal with mean ≈ 0 and standard deviation ≈ 13 points, which is why most ATS edges live in the ±1.5 point window.
Model calibration: predicted vs observed
Predicted win probability bucket vs the empirical win rate inside that bucket on the test set. Points on the y=x reference line are perfectly calibrated; points below mean the model is overconfident in that bucket.