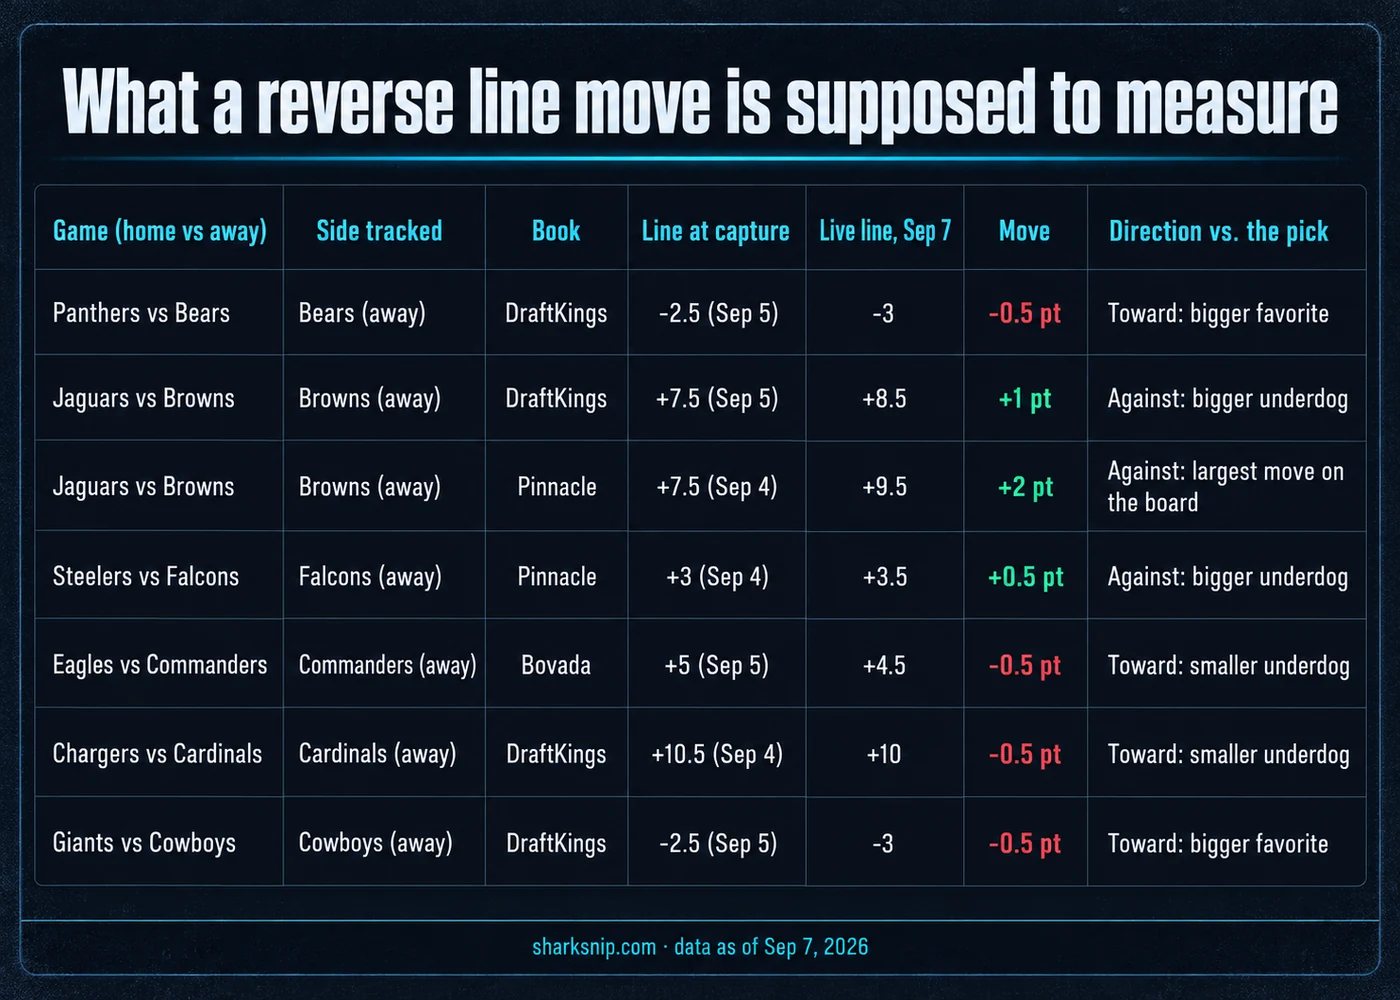

The miss comes first: a reverse line move is not proof that the minority side is right. It is evidence that the market price moved against the reported ticket count. That difference can be useful, but only after the bettor identifies what moved, who reported the split, when the split was captured, and whether the move crossed a key number.
The phrase sounds more precise than the underlying data. A screen may show a majority of tickets on one side and a line moving toward the other side. The temptation is to label the minority “sharp” and stop. That skips the mechanism. Ticket share is a count. Handle share is money. The line is a price. Those three objects can disagree without any of them being false.
What a reverse line move actually measures
A normal public story is simple: more wagers arrive on a team, the book makes that team more expensive, and the market follows. A reverse line move breaks that visible sequence. The majority of reported tickets points one way while the spread, total, or moneyline moves the other way.
The signal is not “the public is wrong.” The signal is “ticket count does not explain the price change.” That leaves several possible causes. The minority wagers may be larger. They may arrive at books whose prices lead the rest of the market. They may arrive after limits rise, when a wager carries more information. A bookmaker may also be reacting to news, correlated exposure, or another market rather than to the displayed split.
A useful read therefore starts with a causal question: what pressure would make a rational market maker accept more tickets on one side while making the other side more expensive? If the answer is visible in the data, the move may contain information. If the answer is missing, the move is only an alert.
Ticket share and handle share answer different questions
Ticket share asks how many recorded wagers selected each side. Handle share asks how much recorded stake selected each side. Neither is the market itself. Both are samples assembled by a vendor, a book, or a network of books. The sample may omit the shops that moved first. It may combine recreational and market-making books. It may update more slowly than the odds feed.
A large ticket majority with a smaller handle share means the average wager on the minority side is larger. That can be consistent with informed action, but it can also reflect one unusually large customer. A handle majority with a ticket minority is stronger evidence of concentrated money, yet it still does not reveal whether that money was respected, copied, hedged, or stale.
Timing matters as much as the shares. Early wagers can move a thin opener. Later wagers can move a mature market only after limits increase. A split captured after the move may describe bets placed at the new price rather than the bets that caused the move. Reading the timestamp backward turns effect into cause.
A worked illustrative example
In this illustrative example, suppose Harbor opens as a -1 favorite over Summit and later trades at +1.5 while Harbor still holds 72% of reported tickets. In this illustrative example, the line has moved against the ticket majority, so the screen qualifies as a reverse line move. In this illustrative example, 72% is a ticket share rather than an ATS win rate; at -110, the ATS break-even is 52.4%.
In this illustrative example, suppose Summit holds 64% of reported handle despite only 28% of reported tickets. In this illustrative example, the minority wagers are larger on average, but the split alone still cannot distinguish a group of informed wagers from one concentrated position. In this illustrative example, 64% and 28% are money and ticket shares rather than ATS win rates; at -110, the ATS break-even is 52.4%.
In this illustrative example, suppose the move appears first at a market-leading book after limits rise and is then copied elsewhere. In this illustrative example, that sequence is more informative than a move isolated at one slow book because the price discovery happened where the market is most willing to accept risk.
In this illustrative example, suppose the available wager is still priced at -110 and a bettor estimates a 53% ATS win rate; -110 requires 52.4% to break even, so the illustrative edge is narrow and disappears with a small probability error. In this illustrative example, ticket share and handle share explain why the move deserves inspection, not why the bet must be made.
Why the signal can be real
Markets aggregate information through price changes. A bettor with a better injury estimate, matchup number, or derivative-market read does not need to publish the reasoning. The wager itself changes inventory and risk. When the wager reaches a book that leads price discovery, the new line communicates that pressure to the rest of the market.
The minority side can therefore move because stake size matters more than bet count. It can move because late, high-limit wagers carry more information than early, low-limit wagers. It can move because several independent bettors attack the same stale number. None of those mechanisms requires a bookmaker to know the final result. The book only needs to conclude that the old price is no longer worth offering.
This is why a reverse line move is a signal rather than a system. It narrows attention to a disagreement between participation and price. The bettor must still decide whether the current number preserves any value after the market has reacted.
The first way it lies: the split is not the market
A split can be accurate for its source and misleading for the broader market. A recreational book may report many small tickets while a market-making book reports none of its flow. A vendor may merge books with different customers and update schedules. The odds feed may be current while the split feed is delayed.
That creates a false reverse move. The displayed majority did not move the price because it did not represent the books setting the price. The cure is confirmation: compare timestamps, compare books, and identify where the move began. If the origin cannot be established, the correct label is “unexplained move,” not “sharp side.”
The second way it lies: handle can be concentrated
Handle share looks more sophisticated than ticket share, but concentration can make it brittle. One large wager can dominate the money column. That wager may be informed. It may also be a hedge, a limit test, a stale-price correction, or a customer whose historical value is unknown.
Repeated movement is more useful than one isolated jump. A market that moves, resists buyback, and continues in the same direction after limits rise has a different shape from a market that flashes and returns. The path matters. A single handle snapshot removes the path.
The third way it lies: a key number changes the price of distance
Football margins cluster around scoring combinations. That makes some spread points more valuable than others. A half-point that crosses a common final margin can alter cover probability more than several half-points in a sparse part of the distribution.
In this illustrative example, a move from +2.5 to +3.5 crosses a key-number band, while a move from +8.0 to +9.0 stays between less common margins. In this illustrative example, both moves span one point on the screen, but they do not carry the same probability change.
This can make a move look stronger or weaker than it is. A book may protect a key number by changing price before changing spread. A bettor who watches only the spread misses the first adjustment. Once the spread crosses the key number, the information may be real but the usable price may already be gone. The mechanism can be correct and the wager can still be NO PLAY.
Spread movement and price movement are one market
A spread screen compresses two dimensions into one headline. Books can adjust the number, the price attached to the number, or both. Moving the price preserves a key spread while making one side more expensive. Moving the spread resets the headline and may invite buyback from bettors waiting for a particular threshold.
This matters because a reverse line move can begin before the spread changes. If the majority side becomes cheaper to back while the minority side becomes more expensive, the market is already leaning against the tickets. A later spread move may only make the earlier pressure visible to a screen that ignores price.
Comparing books requires normalizing those choices. One book may hold the spread and move the price. Another may move the spread and return to a standard price. Those quotations can express similar probability. Treating only the spread-changing book as informative confuses display convention with market belief.
The same rule applies across related markets. A side can move because a quarterback prop, team total, or alternate spread changed the book’s combined exposure. The reverse move may still be meaningful, but its cause is broader than the ticket split shown beside the main spread. A mechanism-first read checks whether the pressure appears in related prices before assigning a story.
What the signal can and cannot support
A confirmed reverse line move can support a narrow claim: informed or concentrated pressure may be acting against the reported ticket majority. It cannot support a claim about the final score. Markets move because participants update probabilities and manage inventory, not because an outcome has become known.
The signal also cannot supply a missing price. If the move has already removed the favorable number, following it can mean paying for information that earlier bettors captured. The question is not whether the move was intelligent. The question is whether the current quotation still offers value after transaction costs, uncertainty, and key-number effects.
That distinction keeps the analysis falsifiable. Record the split source, timestamps, origin book, starting quotation, available quotation, and decision. Grade the wager separately from the market read. A losing bet can follow a coherent signal; a winning bet can follow a broken process. Only repeated, timestamped decisions show whether the mechanism adds information beyond the closing market.
Precommitting the read reduces story selection. Define which split source is acceptable, how stale it may be, which books qualify as price leaders, what counts as confirmation, and which key-number crossings cancel the wager. Without those rules, almost any move can be narrated as sharp after the result. The value of the signal depends on whether the same definition is applied before kickoff and after grading.
A mechanism-first checklist
- Locate the origin. Identify the first book and timestamp rather than treating consensus as the cause.
- Separate tickets from handle. Count and stake answer different questions; neither identifies bettor quality.
- Check the limit regime. A move in a thin opener carries a different meaning from a move after limits expand.
- Inspect price and spread together. Juice changes can reveal pressure before the headline number moves.
- Mark key-number crossings. The probability cost of the move is not linear.
- Price the current wager. A good signal at the old number can be a bad bet at the new number.
The final decision is deliberately plain. A reverse line move earns a closer read. It does not override the model, the injury report, the current price, or the bettor’s confidence floor. When the causal chain is incomplete, NO PLAY is information, not indecision.
Sources and limits
This mechanism explainer uses no live odds, ticket splits, handle splits, graded picks, or team records. Every number in the worked example is explicitly illustrative. Current NFL prices and model decisions belong on the NFL picks surface; the mechanics of spread pricing and key numbers are covered in the NFL spreads guide.
Bet responsibly — set limits, record the price taken, and never chase losses.
Line movement vs public ticket %
Closing line movement (in points) plotted against the share of public tickets on the favored side. Reverse line moves — where the line moves opposite to public ticket flow — are the canonical sharp-action signal.
Model calibration: predicted vs observed
Predicted win probability bucket vs the empirical win rate inside that bucket on the test set. Points on the y=x reference line are perfectly calibrated; points below mean the model is overconfident in that bucket.