Playoff basketball is a different sport than the regular season, and nowhere is that more obvious than in the player props market. Rotations shrink to 8 players, defensive game plans get specific, and individual usage rates can swing 5 percentage points between games. Anyone betting NBA Finals player props off regular-season averages is going to get cooked. This piece walks through how models adjust for the playoff environment, the matchup-specific signals that move lines, and where the public consistently misprices Finals props. The frame we will use is the plausible 2026 matchup of Boston Celtics vs Oklahoma City Thunder — Jayson Tatum, Jaylen Brown, and Derrick White on one side; Shai Gilgeous-Alexander, Chet Holmgren, and Jalen Williams on the other.
Why regular-season averages mislead
A regular season is 82 games against 29 different opponents. Playoff series are 7 games against the same defensive scheme, the same matchup assignments, and an opponent who watches film between every game and adapts. The rotation also tightens — bench players who saw 18 minutes a night in March often play 10 in June. That alone shifts the per-36 numbers for every starter.
So when a book hangs a Finals prop based partly on regular-season production, there is friction in the model. Sharper props markets compensate, but the volume on Finals games is high enough that public money distorts lines for hours at a time. That is the window most retail edges live in. The first hour after Tatum's points line drops for Game 1 is usually the softest the number will be all day.
Usage rate shifts in the playoffs
The single biggest factor in playoff props is usage rate — the share of team possessions a player finishes with a shot, free throw trip, or turnover. Three patterns repeat every postseason:
- Star usage climbs. A 28% regular-season usage star often plays at 32-34% in a Finals series. Nikola Jokic at ~30% regular-season climbed to ~35% in his 2023 Finals run. SGA was 32% reg-season, climbed to ~37% in the 2025 conference finals. That is a 15-20% bump in scoring opportunities per minute, before accounting for matchup difficulty.
- Third options shrink. The third-best scorer on each team usually drops 2-3 percentage points of usage as the offense routes more touches to the top two. Derrick White's 2024 Finals dipped roughly 3 percentage points of usage as the Celtics leaned heavier on Tatum + Jaylen Brown.
- Role players concentrate. The bench rotation tightens to 1-2 players, and their stats become specialist outputs (corner threes, defensive minutes, or rim protection). Aaron Wiggins in OKC's hypothetical Finals role would see his threes-attempted go up but his minutes drop, narrowing his prop range.
If you are betting points props on a star, your model needs to add the playoff usage uplift before applying defensive matchup adjustments. Otherwise you are using a number that systematically underestimates the over on stars and overestimates the over on third options.
Defensive matchup is the dominant input
In the Finals, you usually know exactly who is guarding whom. That makes matchup-specific data far more valuable than aggregate season stats. The relevant questions:
- Who is the primary defender? Their on-ball defensive rating against this archetype matters more than the team's overall rating. Lu Dort on Tatum is a different problem than Jalen Williams on Tatum, even though OKC's team defense is elite either way.
- Are there cross-matches in transition? A switch-heavy scheme creates a different distribution of shots than a drop-coverage team. The Thunder switch more than they drop, which means Tatum gets a steady diet of switches onto smaller guards — favorable for his point total but bad for his three-point efficiency.
- Help-defense scheme — collapse on drives or stay home on shooters? This determines how much of a star's scoring comes at the rim vs from kick-outs. Boston's Kristaps Porzingis altering rim shots is the variable that swings Holmgren's rebound prop and SGA's at-rim conversion rate.
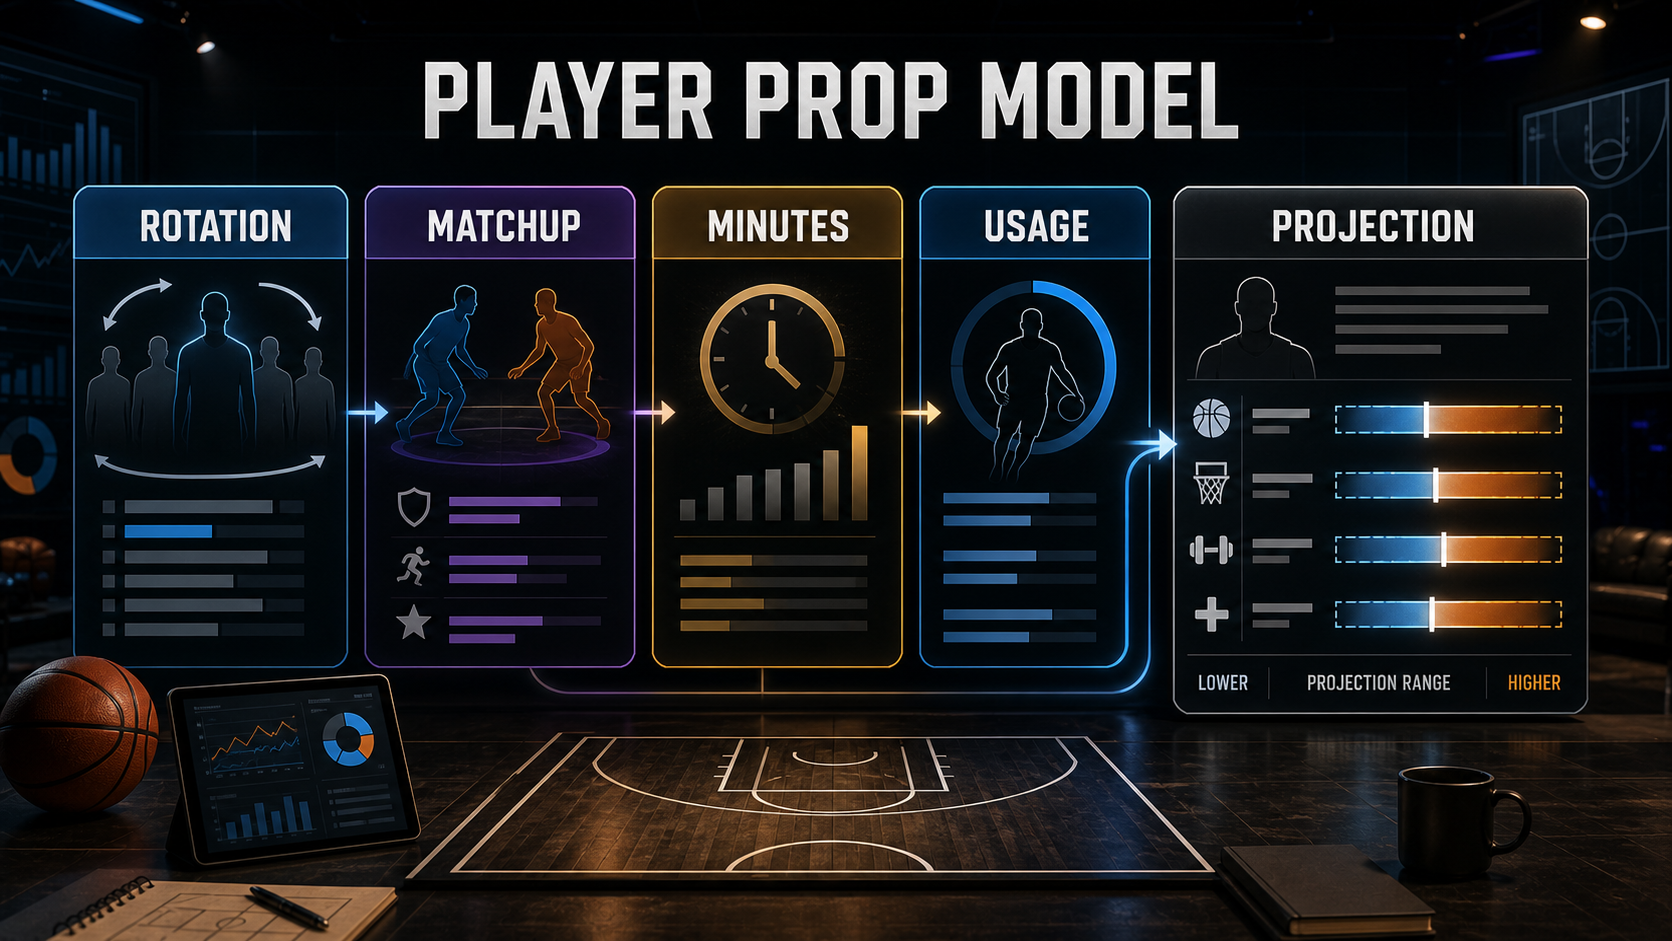
A useful framework: build your projection from minutes × usage × shot quality, then adjust shot quality for the specific defensive matchup. If you are testing this kind of feature mix, the /workshop lets you blend usage, matchup, and rest features into a single prediction target, and /build/new walks you through composing a custom Finals-specific prop model from scratch.
A worked example with concrete numbers
Suppose Tatum averaged 28.4 PPG in the regular season on 64% true shooting and 31.2% usage. In the playoffs through three rounds, those numbers are 30.1 PPG, 60% TS, 33.5% usage on 38 minutes per game. The Finals matchup has him facing Lu Dort with help from Jalen Williams — both top-tier wing defenders. The book hangs the points line at 28.5.
The naïve regular-season number says over 28.5 looks good. But run the actual playoff math:
- Minutes: 38 (matches recent playoff trend, slight uptick if game goes to overtime)
- Usage in Finals: project 33% (regular playoff bump) -1% (top defender steering possessions) = 32%
- True shooting: regular 64% adjusted for the Dort/Williams tandem to ~57% — top wing defenders cost 4-7 percentage points of TS%
- Pace: Finals pace tends to drop 2-3 possessions per 48 vs the season
That projection lands closer to 27.5 PPG, not 30. The over 28.5 is now the wrong side of the line, and the under is the value play. The point is not the specific numbers — it is the workflow: usage adjustment first, then matchup-driven efficiency adjustment, then pace.
SGA running the same gauntlet
Run the same stack on Shai Gilgeous-Alexander going the other way and the math comes out very differently. SGA's regular-season was 32% usage on 64% TS at 32 PPG. Boston's main defenders for him would be Jrue Holiday and Derrick White — both elite point-of-attack but neither has the length to bother SGA's mid-range pull-up the way Dort bothers Tatum's catch-and-shoot. Apply the usage bump, a smaller TS penalty (~3 points), and the pace drop, and SGA projects 30.8 PPG against a line typically hung at 30.5. The over is live. Same framework, opposite conclusion, because the matchup math actually matters.
Fatigue and back-to-back-to-back effects
Finals series are spaced 1-2 days apart, but the cumulative load matters. By Game 5 of a high-leverage series, starters have logged 200+ playoff minutes on top of an 82-game season. Fatigue shows up first in:
- Rebound rate — second-jump effort drops noticeably late in series. Jokic's Game 7 rebound rate in his 2023 run dropped 6 percentage points off his Game 1 number.
- Free throw attempts — drives slow down as legs get heavy. FTA props go under more often after Game 4. Giannis Antetokounmpo's FTA in the 2021 Finals stepped down each game once he was carrying a 38-minute load.
- Three-point percentage — leg-driven shooting fades. Threes-made unders have a real signal late in series. Jaylen Brown's three-point percentage in 2024 Games 5-7 was roughly 6 points below his early-series mark.
If you are tracking these, the projections on /leaderboards surface the model's number alongside the market line, so the rest-and-fatigue adjustment is visible before you click the bet. Community-shared Finals models are listed on /marketplace for head-to-head comparison.
Series-long props: a different beast
Series MVP, total rebounds for the series, total threes for the series — these are derivative props priced off the per-game expectations multiplied by an estimated series length. The hidden input is how the book models series length. A 4-2 series gives you 6 games of production; a 4-0 sweep gives you 4. Books typically average a 5.5-game expectation when the moneyline is around -200 favorite.
That creates an angle: if you have a stronger lean on series length than the book does, series-long props let you express it without betting the moneyline directly. A "shorter than expected" series read favors the underdog's per-series unders and the favorite's per-series overs (because the favorite gets concentrated production per game in a sweep). If you think Celtics-Thunder goes 6 instead of the book's implied 5.5, every Celtics-side series prop gets a free half-game of production tacked on, and the line typically does not move enough to match.
Common mistakes in Finals props
- Anchoring on regular-season averages. The number on the screen is the regular-season fact; the Finals environment is a different distribution.
- Ignoring rest days. A team coming off 4 days rest plays a different game than one on 1 day. Game 3 of a Finals series with a long travel gap shifts pace by 2-3 possessions.
- Betting "name brand" props without matchup context. A star vs a switch-everything defense looks different than the same star vs a drop-coverage scheme. Tatum vs OKC's switches is not the same problem as Tatum vs Dallas's drops in 2024.
- Forgetting the series-MVP narrative pull. By Game 5, the prop on the series-MVP candidate is shaded by name recognition, not production. Jokic in 2023 was already priced as inevitable by Game 4 even though Jamal Murray's per-game production was nearly identical.
Where edge lives most reliably
Across multiple Finals series, three angles repeat:
- Third-option unders. The 3rd scorer on each team is usually the one who shrinks. Their points and assists props skew under. In a Celtics-Thunder Finals, Derrick White and Jalen Williams are the names this would target.
- Star rebound overs when the matchup involves a smaller defender or a switch-heavy scheme that puts the star on a guard for stretches. Jokic against any team that switches him onto a guard is the canonical version.
- Role-player threes-made unders in low-pace, defensive-grind series. The Game 5+ fatigue pattern compounds this.
None of these is a guaranteed cash. They are systematic patterns that show up in the model output more often than coin flip, and the book's adjustment to them lags by 6-12 hours, which is the bettor's window.
Building your own Finals prop model
If you want to test these features yourself rather than trust the model output, the workshop has a starter brick that ingests NBA playoff player-game logs and lets you fit your own usage-uplift coefficient by player archetype. Open the workshop, fork the "nba-playoff-props-v1" brick, and re-fit the usage curve on the last 5 Finals seasons. You should see the same 4-5 point uplift for stars, smaller for second options, negative for third options. If your fit comes back with a flat regular-season-equals-playoff line, your sample is too small or your filter is wrong. Ship the result through build as a live Finals projection that updates every game.
Bottom line
Finals player props reward bettors who treat the playoffs as a different distribution rather than a continuation of the regular season. Usage rates climb for stars and shrink for third options. Defensive matchups dominate the efficiency side of any projection. Fatigue shows up in rebounding, free throw attempts, and three-point shooting late in series.
For ongoing playoff prop projections and matchup-specific reads, see the NBA models in /workshop and the model-vs-market leaderboard at /leaderboards. The deeper math on per-leg correlation and how the same modeling discipline applies to props more broadly is covered in our sibling guides on PrizePicks math and same-game parlay correlation. The Finals are two weeks of concentrated opportunity if you are willing to do the work.
Bet responsibly — set limits, never chase losses.
Sport-specific model signals
Use names as evidence, not decoration. The useful SEO win is that Jayson Tatum, Nikola Jokic, Shai Gilgeous-Alexander, Josh Allen and Ja'Marr Chase and Chiefs, Bills, Eagles and Lions appear inside decisions, thresholds, and internal links instead of being dumped into a keyword list.
- Prop EV example: Luka Doncic points or PRA at 32.5 should be checked against projected minutes, usage without key teammates, pace, spread, and back-to-back fatigue before price.
- MLB: a Dodgers at Rockies first-five total of 5.5 should account for starter xFIP, K-BB%, handedness, Coors Field run environment, wind, bullpen rest, and umpire zone.
- NHL: a Maple Leafs puck-line price at +160 needs confirmed goalie, 5v5 expected-goal share, special-teams edge, and empty-net probability before the margin bet makes sense.
- UFC: an Islam Makhachev-style grappling favorite needs takedown entries, control time, get-up rate, and submission exposure; an Alex Pereira-style striker needs knockdown equity and round-by-round cardio risk.
- DFS value example: NBA showdown builds need projected minutes, usage, salary, ownership, and late-swap flexibility before a star salary is worth paying.
- Stack example: an NBA same-game entry with Doncic points, teammate assists, and opponent threes needs one coherent pace script instead of three unrelated legs.
The goal is not to mention every star. It is to show how the model changes when the example changes from Doncic to Shohei Ohtani, Igor Shesterkin, Connor McDavid, or Tom Aspinall. Revisit and update the board when lineups, minutes, starters, goalie confirmations, weigh-ins, or market prices change.
Research note board
Use this board before clicking a prop, DFS build, or same-game entry. The table is intentionally about thresholds, not fake certainty.
| Step | Input | Example application | Cancel rule |
|---|---|---|---|
| Project the role | Snaps, routes, targets, carries, minutes, or usage | Jayson Tatum volume against the posted line | The player loses the role that created the projection |
| Price the market | Break-even odds, line shopping, hold, payout structure | moneyline compared with sportsbook consensus | Juice or line movement removes the edge |
| Check correlation | Game script, teammate overlap, ownership, late news | Nikola Jokic paired with Chiefs script notes | The legs need different games to happen |
Prop OVER hit rate vs line distance from median
Empirical hit rate of OVER bets as the prop line moves away from the player projection median, measured in standard deviations. A line set 1sd below the median hits ~84% of the time — but books price the juice to match.
Breakeven win % at common American odds
The win rate you need to break even at each price. Pick odds shorter than -150 and you must win >60% just to stay flat — a hurdle most casual handicappers never sustain.