PrizePicks is the most popular daily fantasy app in the country, and for good reason — it is dead simple to use. Pick a player, pick more or less, build an entry, hit submit. But "simple to use" is not the same thing as "easy to win." The payout structure has real implications for what you actually need to hit, and a surprising number of new users never learn how the math works against them. This guide walks through how PrizePicks works, the payout chart, the difference between Power and Flex plays, and the math you need to know before placing a single entry.
How PrizePicks works
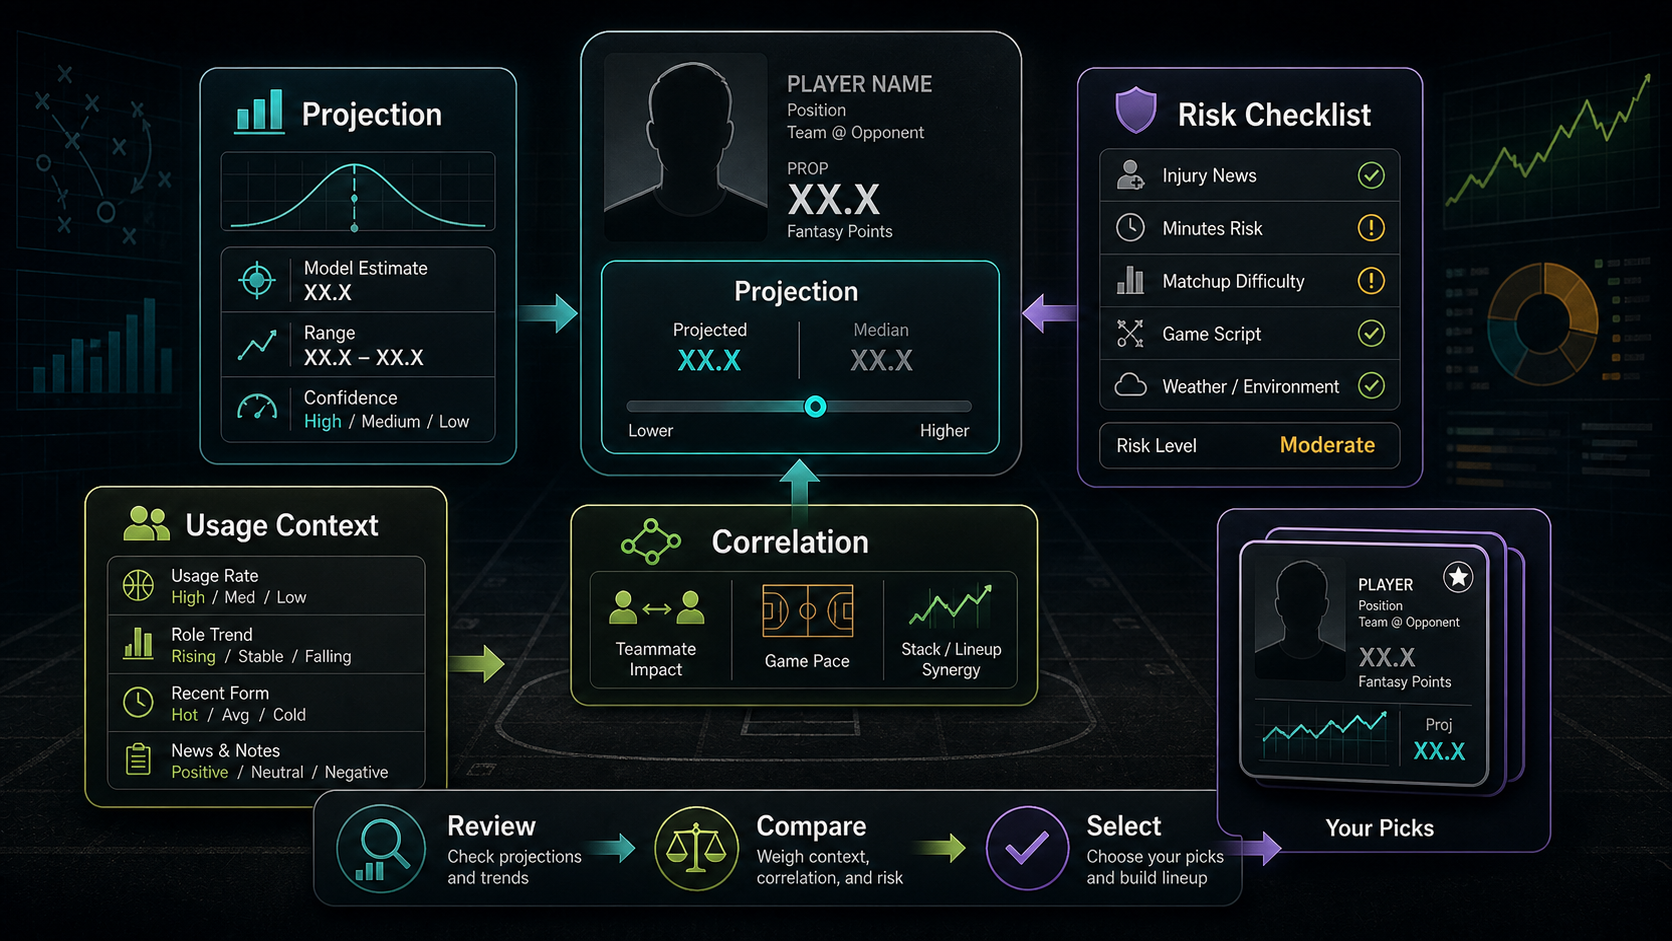
PrizePicks is a daily fantasy contest, not a traditional sportsbook. You build an entry by selecting 2 to 6 player props, called legs. For each leg, you tap "More" (the player goes over the line) or "Less" (the player goes under). When the games end, the app grades each leg.
The key difference from a sportsbook: PrizePicks always shows you the multiplier upfront. There is no -110 or +120 juice on individual legs. The price is built into the overall payout for the entry size you pick.
The two contest types
- Power Play (standard): All legs must hit. If even one misses, the entire entry loses.
- Flex Play: Partial wins allowed. You get a reduced payout if one (or sometimes two) legs miss, depending on the entry size. Flex requires a minimum of 3 legs.
Flex sounds like the safer choice — and emotionally, it is. But the math is harsher. Flex pays significantly less per leg won because of the partial-win cushion, and the multiplier on a perfect Flex entry is much smaller than a perfect Power entry.
The PrizePicks payout chart
Here is the standard payout structure (subject to change by region and contest):
Power Play
- 2 picks: 3x
- 3 picks: 5x
- 4 picks: 10x
- 5 picks: 20x
- 6 picks: 25x
Flex Play
- 3 picks: 2.25x if all hit, 1.25x if 2 of 3 hit
- 4 picks: 5x if all hit, 1.5x if 3 of 4 hit
- 5 picks: 10x if all hit, 2x if 4 of 5 hit, 0.4x if 3 of 5 hit
- 6 picks: 25x if all hit, 2x if 5 of 6 hit, 0.4x if 4 of 6 hit
A $10 entry on a 4-pick Power play returns $100 if every leg cashes. The same $10 entry on a 4-pick Flex play returns $50 if all four cash, $15 if three of four cash, or $0 if two or fewer cash.
The math: what you actually need to hit
This is the part most beginners skip. Each contest size has a break-even hit rate per leg — the win rate per leg you need across thousands of entries just to not lose money. For Power plays, assuming each leg is independent (it is not always — more on that below):
- 2-pick at 3x: need 57.7% per leg
- 3-pick at 5x: need 58.5% per leg
- 4-pick at 10x: need 56.2% per leg
- 5-pick at 20x: need 54.9% per leg
- 6-pick at 25x: need 57.1% per leg
Sportsbook spreads at -110 require 52.4% to break even. PrizePicks props require roughly 55 to 58 percent per leg depending on entry size. That is a meaningful gap. The lines on PrizePicks are also typically a half point or so off the sharp market, which means edges exist — but they are smaller than they look on the surface.
The independence assumption
The math above assumes every leg is independent. They almost never are. If you stack three Lakers props all aligned with a blowout (Lakers win big), a tight final score makes them all miss together. Correlation cuts both ways — it can boost your equity if you stack on purpose, or sink you if you do it accidentally.
Concrete example
You build a 4-pick Power play for $25:
- LeBron James — Points: More 24.5
- Stephen Curry — Threes Made: Less 4.5
- Nikola Jokic — Rebounds: More 12.5
- Devin Booker — Points: More 27.5
If every leg cashes, you win $250 (10x your stake). If even one misses, you lose your $25. Suppose your real model has each leg projected at 58 percent. The probability all four hit is 0.58^4 = 11.3%. Expected return: 0.113 * $250 = $28.30, against a $25 stake. That is roughly a 13 percent edge — solid, but only if your 58% per leg estimate is genuinely accurate over a large sample.
Now imagine your true hit rate is 53 percent per leg (closer to a casual bettor). All four hit with probability 0.53^4 = 7.9%. Expected return: 0.079 * $250 = $19.75. You are losing $5.25 per $25 entry on average. That is the difference between actual edge and "I feel good about these picks."
How to actually win on PrizePicks
- Bet smaller entry sizes. 2 and 3-pick Power plays have less variance and less compounding risk.
- Find soft lines. PrizePicks lines for less-followed stats (rebounds, assists, threes) are often a half point off the sharp number. Compare to a sportsbook before you submit.
- Track every entry. Logging picks, lines, and results is the only way to know if your hit rate is actually above break-even.
- Use correlation on purpose. A QB's passing yards and his WR1's receiving yards are positively correlated. Stack them on the same side. The deeper correlation framework is laid out in our same-game parlay math guide — a sibling piece on how leg dependence really works.
- Use a model. A consistent process beats vibes every single time over a long sample. The /workshop outputs prop projections for every major sport, and /leaderboards shows which models are actually beating the lines week over week.
- Treat it like a strategy game. Build a custom prop model from scratch at /build/new — pick features, target a stat, and let the system tell you whether your edge clears 55 percent.
Common beginner mistakes
- Always going for the max parlay. 6-pick entries look glamorous on social media; they have terrible hit rates.
- Stacking only "favorite" players. The line moves to account for popularity. Star-heavy slips are usually slightly underpriced.
- Ignoring injury news. Lines update slower than the news. A late scratch you missed will sink an entry.
- Re-betting after losses. The classic chase. Walk away.
- Treating Flex as "safe." Flex pays less per leg cashed. The reduced upside often outweighs the reduced bust risk.
How PrizePicks compares to a sportsbook
PrizePicks is not a sportsbook. There is no single-prop wager — you must build at least a 2-leg entry. The "vig" is the gap between the multiplier and the true odds, which is steeper than a single -110 sportsbook bet. The tradeoff is that PrizePicks is legal in many states where sportsbooks are not, and the interface is dramatically simpler.
For DFS strategy that goes beyond props — full lineups, salaries, optimization — see the /gridiron lineup tools, or compare daily edge picks against community sharps on /marketplace.
Bottom line
PrizePicks is simple to play and hard to beat. The payout chart is clear, but the break-even hit rate per leg is meaningfully higher than a sportsbook spread. To win long term you need a real edge per leg — usually 55 to 58 percent — which means projection-based picks, soft lines, intentional correlation, and disciplined entry sizing. Skip the 6-pick lottery tickets, log every entry, and treat it like the math problem it is.
If you stay disciplined and lean on a process, PrizePicks can absolutely be beaten. If you tap "More" on whichever player you have heard of most recently and submit a max parlay, the math will eat you alive.
Bet responsibly — set limits, never chase losses.
Props and DFS example board
For props, DFS, and PrizePicks-style decisions, the names should reveal the input. Jokic assists, Shai points, Wembanyama blocks, Josh Allen rushing, Ja'Marr Chase receptions, and Christian McCaffrey touchdown equity all require different checks. Treat each player as a role-and-price puzzle rather than a logo on a pick card.
- Fixed-line check: compare the app line to sportsbook consensus before calling it an edge.
- Correlation check: do not pair legs that require opposite game scripts.
- DFS check: salary, ownership, and late-swap flexibility can matter as much as median projection.
- Tracking check: grade closing value and result separately so a lucky hit does not hide a bad line.
Props workflow links
Use PrizePicks basics, NFL player props, and correlation math as the internal loop from projection to price to risk control.
Prop, DFS, and contest examples
Use names as evidence, not decoration. The useful SEO win is that Nikola Jokic, Josh Allen, Ja'Marr Chase, Bijan Robinson and Puka Nacua and Chiefs, Bills, Eagles and Lions appear inside decisions, thresholds, and internal links instead of being dumped into a keyword list.
- Prop EV example: if Amon-Ra St. Brown receptions are 6.5 at -120, a model median of 7.1 with a 56% over probability creates a fair threshold near -127; pass if the market jumps to 7.5 without a projection change.
- DFS value example: projection divided by salary times 1,000 keeps the slate honest. A 20.4-point projection at $7,200 is 2.83x median value; tournaments need ceiling, leverage, and correlation on top of that.
- Stack example: Patrick Mahomes with Travis Kelce and Xavier Worthy needs a bring-back plan from the opponent; Josh Allen with Keon Coleman and Dalton Kincaid needs rushing-TD cannibalization in the script notes.
- PrizePicks example: Nikola Jokic rebounds, Devin Booker points, and Stephen Curry threes should not be treated as one generic “More” card; legs need hit rate, payout, and correlation checks.
The next step should be a tool, not another opinion: compare the line on NFL player props, pressure-test salary in DFS tools, and log the close with bet tracking.
Research note board
Use this board before clicking a prop, DFS build, or same-game entry. The table is intentionally about thresholds, not fake certainty.
| Step | Input | Example application | Cancel rule |
|---|---|---|---|
| Project the role | Snaps, routes, targets, carries, minutes, or usage | Nikola Jokic volume against the posted line | The player loses the role that created the projection |
| Price the market | Break-even odds, line shopping, hold, payout structure | vig compared with sportsbook consensus | Juice or line movement removes the edge |
| Check correlation | Game script, teammate overlap, ownership, late news | Josh Allen paired with Chiefs script notes | The legs need different games to happen |
Prop OVER hit rate vs line distance from median
Empirical hit rate of OVER bets as the prop line moves away from the player projection median, measured in standard deviations. A line set 1sd below the median hits ~84% of the time — but books price the juice to match.
Breakeven win % at common American odds
The win rate you need to break even at each price. Pick odds shorter than -150 and you must win >60% just to stay flat — a hurdle most casual handicappers never sustain.