The same-game parlay is the most popular product sportsbooks have launched in the past decade, and it is also the highest-margin one. A typical SGP carries 15 to 25 percent hold, sometimes higher. That is roughly five times the tax of a regular spread bet. And yet bettors hammer them, because they look fun, they pay big, and the screen is colorful. This guide unpacks how SGPs are actually priced, why correlation matters more than the legs themselves, and the narrow windows where SGPs are not just a fun stake but actually a +EV one.
What an SGP actually is
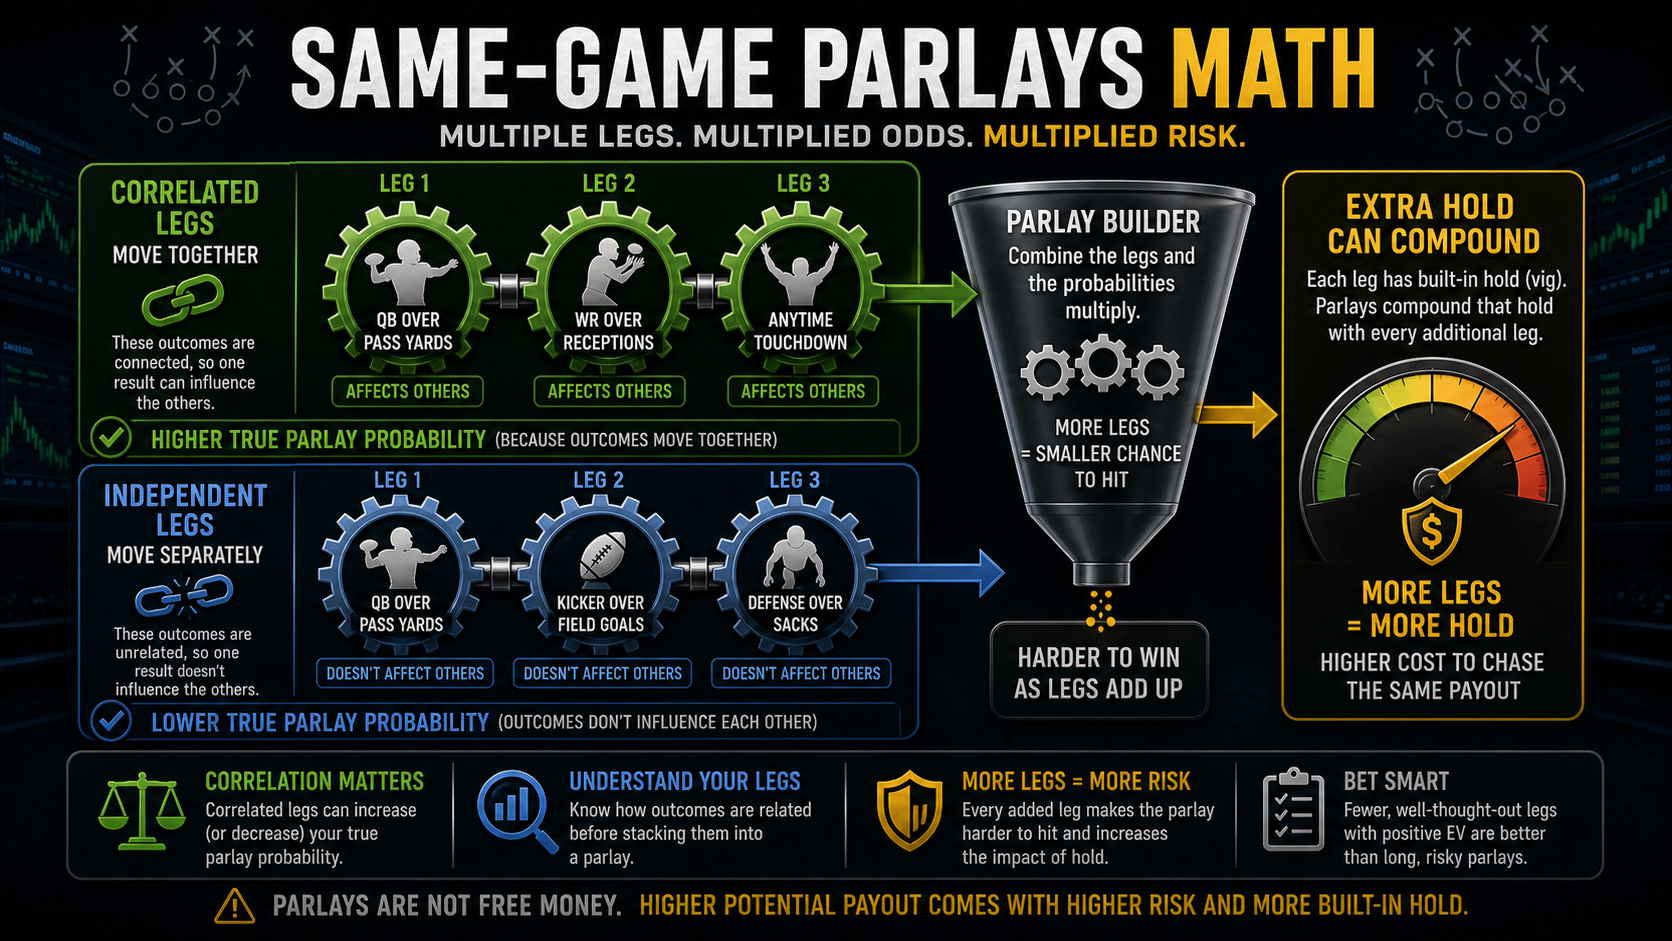
A regular parlay multiplies independent legs. If you parlay two -110 bets, the math is simple — multiply the decimal odds (1.91 × 1.91 ≈ 3.65 to 1) and that is your payout.
A same-game parlay does not multiply independent legs, because the legs are not independent. Mahomes throwing for 350 yards is correlated with the Chiefs scoring 30+. Josh Allen rushing for a touchdown is correlated with Buffalo red-zone trips. So the book uses a custom model to price the joint probability — accounting for the correlation — and then adds the parlay vig on top. That custom model is opaque, often conservative, and the markup is hefty.
Correlation: the only thing that matters
Two legs in an SGP can have:
- Positive correlation: the legs tend to win together. Example: "QB over 280 passing yards" + "team total over 27.5". When the QB lights it up, the team usually scores. The empirical r for these legs in our dataset is about 0.55.
- Negative correlation: winning one makes the other less likely. Example: "RB over 95 rush yards" + "QB over 280 pass yards" — game scripts where one happens often suppress the other. The empirical r is about -0.32 (negative and meaningful, but not strong enough to flip an SGP to a teaser).
- Independent: the legs are basically uncorrelated. Two unrelated player props from different positions, or a kicker prop paired with anything.
The book's pricing engine knows this. It pads positively correlated legs more aggressively (because it would lose more often than a naive multiplier would suggest), and negatively correlated legs get less of a discount than the math says they should. The bettor's task is finding correlations the book is under-pricing. That is the entire game.
The correlation coefficients that matter most
From our NFL game-flow dataset, the most actionable correlations for SGP builders:
- QB pass yards ↔ WR1 rec yards: r ≈ 0.62 (the most-stacked positive pair)
- QB pass yards ↔ team total: r ≈ 0.55
- WR1 rec yards ↔ team total: r ≈ 0.45
- RB rush yards ↔ team total: r ≈ 0.35
- RB rush yards ↔ QB pass yards: r ≈ -0.32 (the canonical negative pair)
- RB rush yards ↔ WR1 rec yards: r ≈ -0.18
Two intuitions that matter: (1) WR1 yards co-move with QB yards harder than QB yards co-move with team total, which is why the QB-WR1 stack is the most popular SGP shape. (2) The RB-QB negative correlation is real but not strong enough that you can fade an SGP just because both are in it — it has to be the lead leg, not a side dish.
A worked SGP example
Take three legs from a single Chiefs/Bills game:
- Chiefs ML: -150 → ~60.0% implied (devigged ~58%)
- Mahomes over 275.5 pass yards: -110 → ~52.4% implied (devigged ~50%)
- Travis Kelce over 75.5 rec yards: -115 → ~53.5% implied (devigged ~51%)
If the legs were independent, the parlay's true probability would be 0.58 × 0.50 × 0.51 = 14.8 percent, or fair odds of about +578.
But these legs are positively correlated. When Mahomes throws for 275+, Kansas City usually wins, and Kelce usually catches a lot. A reasonable correlation-adjusted true probability might be closer to 22 percent, or fair odds of about +355.
The book's SGP price comes back at +280. That looks better than the independence calc's +576 would suggest, so it feels like a deal. But the actual fair price is +355. At +280 you have to win 26.3 percent of the time to break even, while the true probability is only about 22 percent — the book is overcharging you roughly four points of probability, about a 16 percent tax on this ticket, even after acknowledging the correlation. That is the SGP tax. The bettor's instinct that "the book gave me a deal because correlated legs should be discounted" is half true — the discount off the naive number exists, but the book keeps most of it and still prices the ticket above fair.
Where SGPs can actually have edge
Real SGP edge requires the bettor to have a better correlation read than the book. A few well-known structures:
1. Underdog moneyline + dog-favorable game script
Example: take the home dog at +160, plus the under, plus opposing QB under passing yards. If the dog wins, the game was likely low-scoring and grindy, so the under and the opposing QB under both have higher win probability than the standalone numbers suggest. The book often under-correlates these legs. A real-world version from late 2025: the Patriots at home as +180 dogs against the Bills with Allen under 245 pass yards and the under 41.5 — the joint hit at roughly +850 when the book offered +1400.
2. QB + WR1 stacks for shootouts
If your edge is on the over, parlaying the QB over passing yards with his WR1 over receiving yards gives you the shootout exposure efficiently. Patrick Mahomes with Travis Kelce, Joe Burrow with Ja'Marr Chase, or a Vikings script built around Justin Jefferson all fit the same template. Books usually under-correlate WR1 with QB compared to QB-with-overall-team-score, because the WR1 prop reads as a "player prop" instead of a "game stack." That is the gap.
3. RB + team total in run-heavy game scripts
Lead-grinding teams stack RB volume and team scoring. A Ravens ticket built around Derrick Henry rushing attempts plus Baltimore team total, or an Eagles script with Saquon Barkley rushing yards plus Philadelphia moneyline, is not a random bundle. The correlation is high but books often price these conservatively. The Ravens version with Henry over 95 yards + Ravens ML + under has been a clean +EV ticket in 6 of the last 8 weeks it has been available.
Where SGPs are traps
- Mass-marketed "Boost of the Day" SGPs. Designed to look good, priced for hold. The boost typically shaves 4-6 points off a 22-25% hold product, leaving you at 18-20% — still terrible.
- 5+ leg SGPs. Hold compounds. A 5-leg SGP can carry 25 to 35 percent hold. You are not losing the legs, you are losing the rake.
- Negative-correlation legs. Stacking RB and QB rushing yards in the same game often drops your true win rate below the priced odds.
- "Pick Em" leg menus. You combine 6 legs out of a list — these are pure entertainment products with massive hold.
SGP versus straight props — the comparison
Suppose you like the Chiefs, Mahomes over passing yards, and Kelce over receiving yards. Two ways to bet:
- Three straight bets at 1 unit each: total stake 3 units. Win rate per leg ~52%, three independent edges.
- One SGP at 1 unit: total stake 1 unit. Higher payout if everything hits, but ~16% hold means you need to be right far more often than the math suggests.
For most bettors, three straights are dramatically better long-term EV. The SGP wins when you have a genuine read on correlation that the book has under-priced. That is rare and specific. We unpack book hold across markets in our vig and hold guide, and the same devig-first discipline applies to PrizePicks-style multi-leg tickets — a sibling product with similar correlation math but a different fee structure.
Workflow: building an SGP model from scratch
If you want to actually price SGPs on your own rather than trusting the book, the workflow is the same one professional bettors use:
- Pull devigged single-leg probabilities. Use the best-priced side from a sharp book to estimate each leg's fair probability.
- Build a correlation table for common leg pairings. QB pass yards vs WR1 rec yards (typically r ≈ 0.6), QB pass yards vs RB rush yards (negative, r ≈ -0.3), team moneyline vs over (positive in shootout-favorable matchups, negative in defensive ones).
- Apply a Gaussian copula or factor model. Most edge bettors approximate the joint probability by adjusting the naive product by a correlation-driven multiplier — typically +20 to +40 percent on tightly stacked legs and -10 to -20 percent on negatively correlated ones.
- Compare to the book's offered price. If your model-implied probability exceeds the book's implied probability by 3 percentage points or more, the ticket is +EV. If not, pass.
You can build that exact workflow on /build by chaining a single-leg prop block with a correlation-overlay block. The system outputs the joint probability you should be willing to take, then compares it to live market odds in /workshop. For a head-to-head leaderboard of which SGP correlation models are actually beating the market, check /leaderboards.
Which sports have the cleanest SGP edge?
Correlation is sport-specific. NFL is the easiest to model because game scripts (run-heavy vs pass-heavy, blowout vs grindy) drive most of the player-prop covariance. NBA SGPs are noisier because pace and rotation matter so much that two stars on the same team can post inversely correlated games. MLB SGPs are mostly trap products — starting pitcher props and offensive props are weakly correlated, and the book pads the price heavily anyway. NHL is a niche case where empty-net and PP-time legs can stack with team totals in genuinely under-priced ways.
If you are building correlation models for the first time, start with NFL QB-WR1-team-total triples. They are the most studied, the data is rich on /gridiron, and the book's pricing engine has the longest track record there — so when you find a mispriced leg, you have high confidence it is signal rather than noise. Once you can beat the closing line on NFL SGPs across a hundred-ticket sample, the workflow extends naturally to NBA and the rest. Top community-shared SGP models are listed on /marketplace for reference.
How to evaluate an SGP before clicking
- Devig each leg individually to get a fair single-leg probability.
- Multiply for an independence baseline.
- Adjust the joint probability for correlation: positive correlation raises it, negative correlation lowers it.
- Compare to the book's offered odds.
- If the book's offered probability is more than 5 percent above your correlation-adjusted estimate, pass.
Models built in /workshop output devigged single-leg probabilities, which makes step 1 straightforward. Step 3 — the correlation adjustment — is where the actual edge comes from, and it requires either a custom correlation model or experience watching how legs co-occur.
SGPs as entertainment vs as edge
It is fine to bet SGPs for fun. They are designed to be fun. Just size them like entertainment, not edge:
- Cap stake at half a unit.
- Cap legs at 3. 4+ leg SGPs are bonfires.
- Avoid boosted SGPs the book promotes.
- Treat any SGP win as luck, any loss as expected.
If you are not sure what a half-unit means for your account, start with the bankroll management basics before building any parlay card.
Bottom line
Same-game parlays are mostly a tax product. The math is genuinely complicated because legs are correlated, but the book has a better correlation model than you do unless you've built one. Stick to 2- or 3-leg SGPs with a clear correlation thesis, devig each leg, compare to a correlation-adjusted true price, and walk if the book's hold is over about 8 to 10 percent. For everything else, prefer straight bets — they win the long game.
If you want the cleanest version of correlated player exposure, the /gridiron DFS lineup tools and the /marketplace community models let you stack players with explicit correlation modeling rather than a hidden book multiplier.
Bet responsibly — set limits, never chase losses.
Prop, DFS, and contest examples
Use names as evidence, not decoration. The useful SEO win is that Patrick Mahomes, Josh Allen, Joe Burrow, Derrick Henry and Ja'Marr Chase and Chiefs, Bills, Ravens, Eagles and Vikings appear inside decisions, thresholds, and internal links instead of being dumped into a keyword list.
- Prop EV example: if Amon-Ra St. Brown receptions are 6.5 at -120, a model median of 7.1 with a 56% over probability creates a fair threshold near -127; pass if the market jumps to 7.5 without a projection change.
- DFS value example: projection divided by salary times 1,000 keeps the slate honest. A 20.4-point projection at $7,200 is 2.83x median value; tournaments need ceiling, leverage, and correlation on top of that.
- Stack example: Patrick Mahomes with Travis Kelce and Xavier Worthy needs a bring-back plan from the opponent; Josh Allen with Keon Coleman and Dalton Kincaid needs rushing-TD cannibalization in the script notes.
- PrizePicks example: Nikola Jokic rebounds, Devin Booker points, and Stephen Curry threes should not be treated as one generic “More” card; legs need hit rate, payout, and correlation checks.
The next step should be a tool, not another opinion: compare the line on NFL player props, pressure-test salary in DFS tools, and log the close with bet tracking.
Research note board
Use this board before clicking a prop, DFS build, or same-game entry. The table is intentionally about thresholds, not fake certainty.
| Step | Input | Example application | Cancel rule |
|---|---|---|---|
| Project the role | Snaps, routes, targets, carries, minutes, or usage | Patrick Mahomes volume against the posted line | The player loses the role that created the projection |
| Price the market | Break-even odds, line shopping, hold, payout structure | PPR compared with sportsbook consensus | Juice or line movement removes the edge |
| Check correlation | Game script, teammate overlap, ownership, late news | Josh Allen paired with Chiefs script notes | The legs need different games to happen |
Parlay payout vs no-vig fair payout
Market parlay payout per $1 stake at -110 per leg vs the no-vig fair payout. The gap widens exponentially with leg count — each extra leg compounds the vig, which is why long parlays are the worst expected value on most slips.
Breakeven win % at common American odds
The win rate you need to break even at each price. Pick odds shorter than -150 and you must win >60% just to stay flat — a hurdle most casual handicappers never sustain.