Updated Sep 7, 2026 · Week 1 board.
Two numbers hiding inside one price
A price like −114 isn't a probability yet. Two formulas turn it into one. Negative price: the size of the price divided by that size plus 100. Positive price: 100 over the price, plus 100.
Run both sides of any two-way market through that, favorite and dog, over and under, and the two probabilities you get add up to a little more than 1.0. Never exactly 100%. That overflow, the amount past 1.0, is what we came here for.
Removing the vig: the no-vig formula
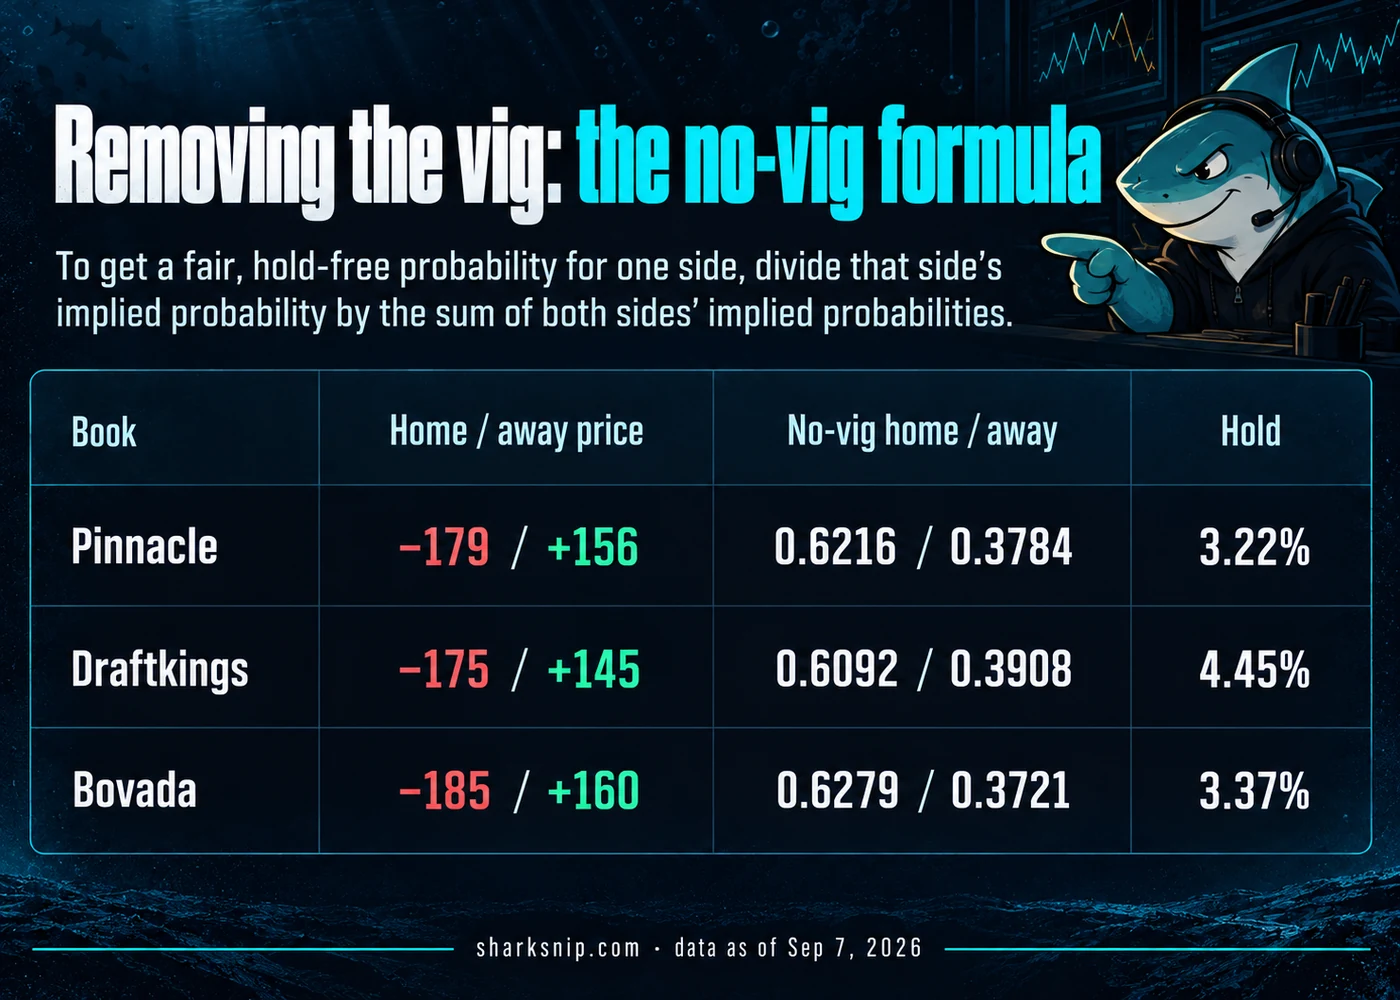
To strip it out, divide one side's implied probability by the sum of both sides'. That's the entire operation. However far that sum runs over 1.0 is the book's hold on that market, and it is the money you're paying for the privilege of having an opinion.
New England at Seattle, priced three ways
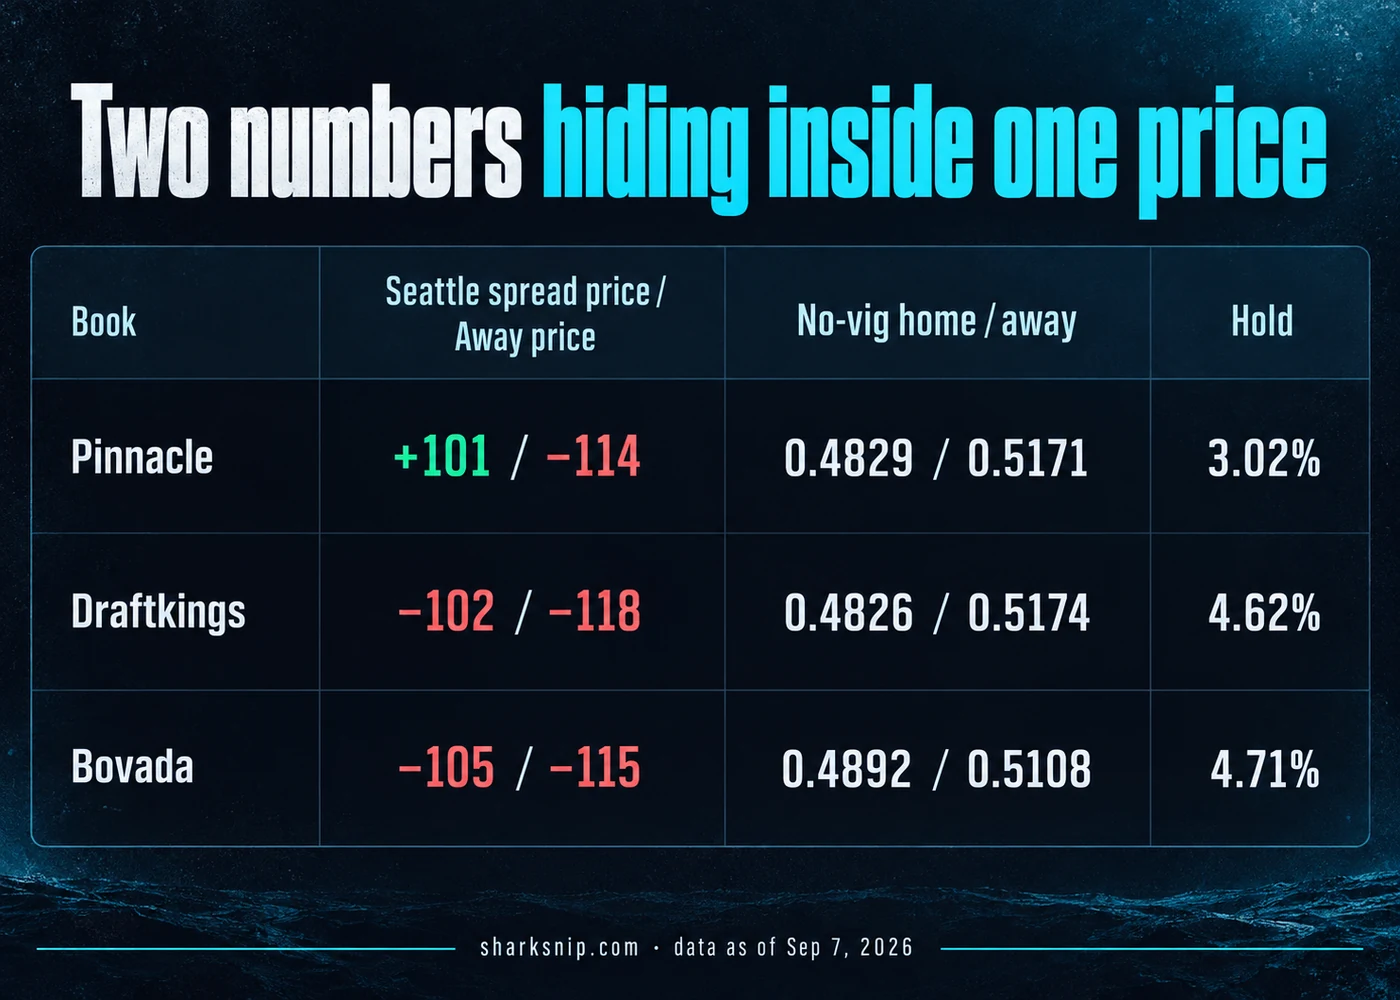
All three books here, Pinnacle and DraftKings and Bovada, have Seattle at −3.5 and the game at 44.5. If a matching line settled the question, the fair probability behind it would match too. It doesn't. The prices bolted onto that identical line differ at every window, and you can watch it happen in the 0.4829 against the 0.4826 below.
| Book | Seattle spread price / Away price | No-vig home / away | Hold |
|---|---|---|---|
| Pinnacle | +101 / −114 | 0.4829 / 0.5171 | 3.02% |
| Draftkings | −102 / −118 | 0.4826 / 0.5174 | 4.62% |
| Bovada | −105 / −115 | 0.4892 / 0.5108 | 4.71% |
Do Pinnacle by hand. Seattle, home, is +101, so the implied probability is 100 divided by 100 plus 101, which comes to 0.4975. New England, away, is −114: that's 114 divided by 114 plus 100, or 0.5327. Add the two and you get 1.0302.
There is your 3.02% hold, sitting in plain sight. Split each side by that 1.0302 and out come the fair numbers in the table. 0.4829 for Seattle. 0.5171 for New England.
Now DraftKings, same −3.5, priced −102 and −118. Implied 0.5050 and 0.5413, which sum to 1.0463. A 4.62% hold. Their no-vig Seattle number lands at 0.4826, three ten-thousandths off Pinnacle's 0.4829.
Same line in the screenshot, and a heavier cut underneath it than Pinnacle's 3.02%.
The total does the same thing. All three post 44.5. Pinnacle prices it −105 and −111, which puts the no-vig over at 0.4933 with a 3.83% hold. DraftKings and Bovada both price it −105 and −115, no-vig over 0.4892, hold 4.71%.
Two books quoting the identical price pair land on the identical fair number, and that's the tell. Matching prices produce matching probabilities. A matching line on its own produces nothing.
The moneyline tells the widest version of the same story
| Book | Home / away price | No-vig home / away | Hold |
|---|---|---|---|
| Pinnacle | −179 / +156 | 0.6216 / 0.3784 | 3.22% |
| Draftkings | −175 / +145 | 0.6092 / 0.3908 | 4.45% |
| Bovada | −185 / +160 | 0.6279 / 0.3721 | 3.37% |
On the moneyline the no-vig home win probability runs from 0.6092 at DraftKings to 0.6279 at Bovada. Nearly two full percentage points. Same game, same day, same two teams. All of it coming out of how each shop decided to price its own moneyline.
This isn't a fluke that happens to run across three markets. Every market on a board carries its own hold, priced on its own. A shop can shade tight on one market and wide on another for the same two teams on the same afternoon. Read the line, skip the price, and you never see a cent of the 3.02% or the 4.71%.
What a matching line across books does and does not tell you
A line that matches at every book, the way it does here on both markets, tells you the market has agreed on a number. It tells you exactly nothing about the vig agreeing. The vig is what sets the fair probability you're supposed to be measuring your own model against. Treat an identical line as proof the math is settled and you've skipped the step that decides the answer, which is whose prices you happened to be reading.
For the points-edge version of this, our own projected number against the line instead of a price turned into a probability, there's a companion piece on model versus market.
Live prices across books on this game, and every other Week 1 game, are all one click away, over at our desk for NFL odds, with the whole slate at the full odds board. If you'd rather have the arithmetic done for you, use our odds converter, or the EV tool once you want the payout too.

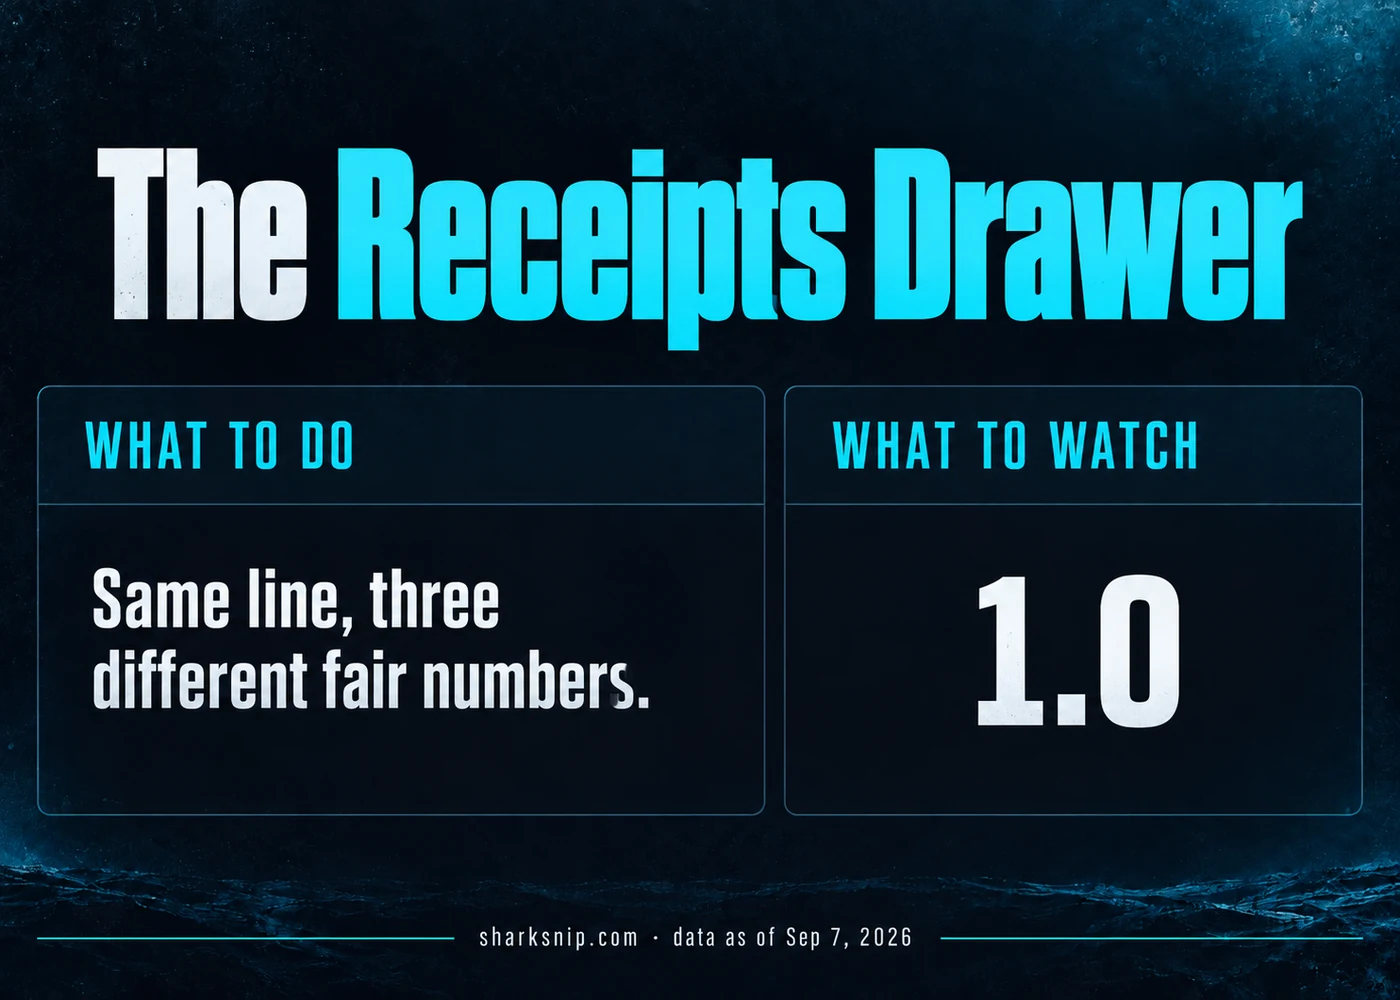
The Receipts Drawer
One line, three different fair numbers. Pinnacle holds 3.02% on this spread and Bovada holds 4.71%, and that difference is not noise. It's the cut, turning up exactly where the arithmetic says it should. The moneyline gap is wider still, almost two points between DraftKings and Bovada on a single game.
Only the prices move any of this. Not the line. The prices. So check the price before you pick a window, and if anything moves before kickoff, pull the odds desk up again and run the division a second time.