Updated Sep 7, 2026 · Week 1 board.
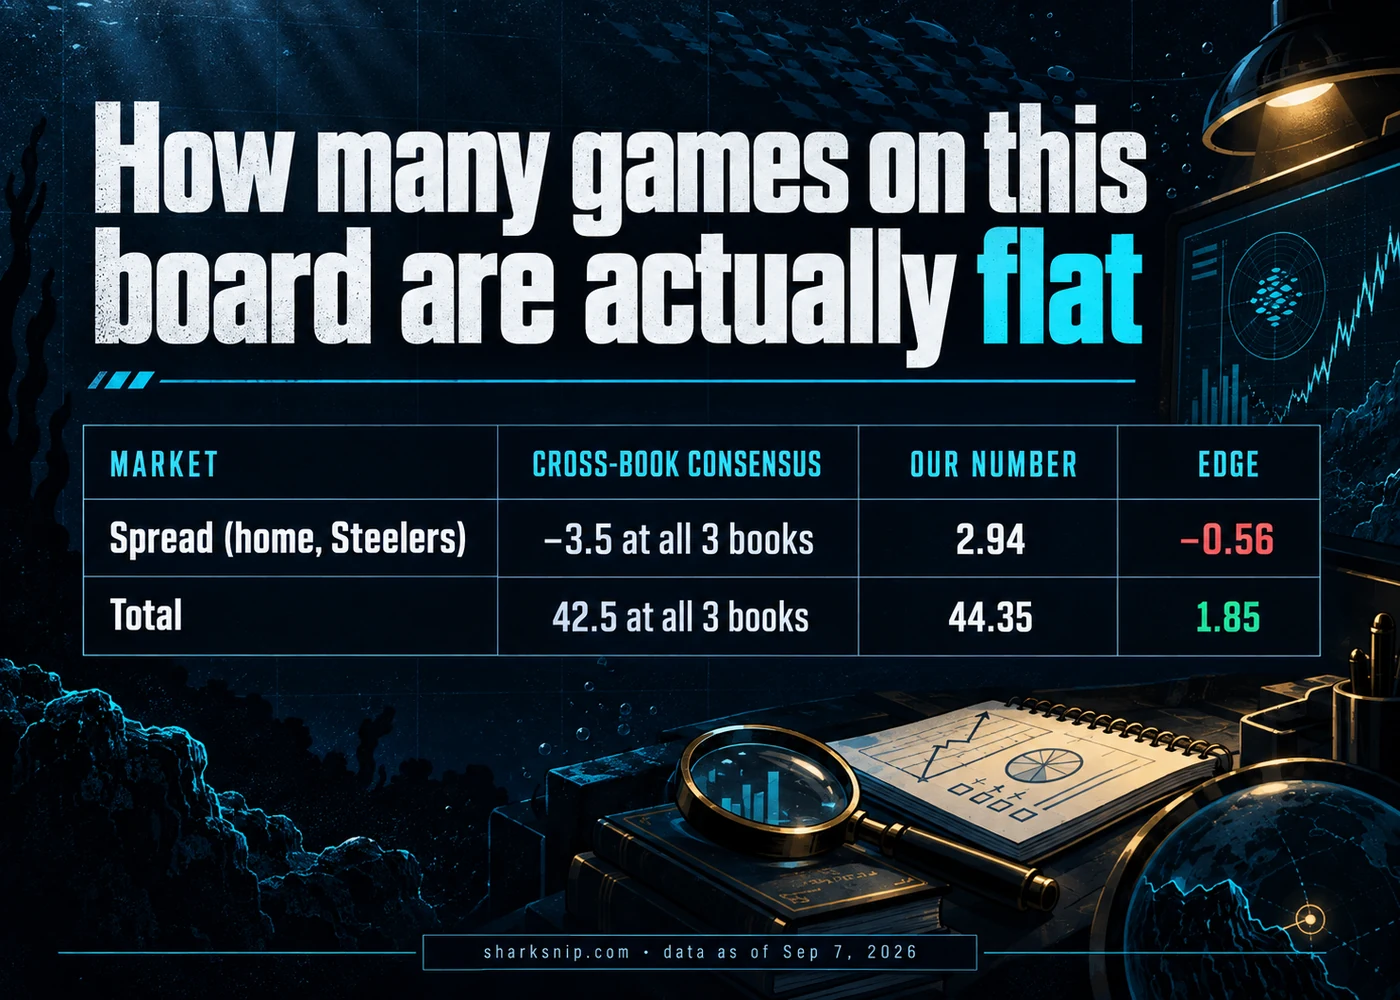
How many games on this board are actually flat
Of the 16 Week 1 games on the current board, 7 show zero spread range across Pinnacle, DraftKings and Bovada. 3 show zero total range. Two games, New England at Seattle and Atlanta at Pittsburgh, are flat on both markets at once. That’s the real, current version of “consensus” this board can support. A specific, countable subset of games where three independently priced books land on the identical number. Not 71 sources agreeing on everything.
What flat means, and what it doesn’t measure
A flat spread or total measures one thing. Three books, pricing independently, arrived at the same market number. It doesn’t measure whether our own model agrees with that number. Those are different questions, answered by different data. The odds board answers the first. Our own projection-versus-line comparison answers the second. A flat answer to the first doesn’t require a flat, zero-edge, answer to the second.

Testing the claim on the flattest game: Atlanta at Pittsburgh
Atlanta at Pittsburgh is flat on both markets. −3.5 for the home Steelers, 42.5 for the total, at all three tracked books. Our own published picks for this exact game read: spread, market line 3.5, our number 2.94, edge −0.56. Check it: 2.94 − 3.5 = −0.56, on the home side, which is why we published the road underdog, Atlanta. Total: market line 42.5, our number 44.35, edge 1.85. Check that too: 44.35 − 42.5 = 1.85. A perfectly flat, three-book board, and a real edge on both of its markets, same game, same time.
| Market | Cross-book consensus | Our number | Edge |
|---|---|---|---|
| Spread (home, Steelers) | −3.5 at all 3 books | 2.94 | −0.56 |
| Total | 42.5 at all 3 books | 44.35 | 1.85 |
A second flat board, a second real edge: New England at Seattle
New England at Seattle is the other game on this week’s board flat on both markets. −3.5 for the home Seahawks, 44.5 for the total, at Pinnacle, DraftKings and Bovada alike. Our published total pick for this game reads: market line 44.5, our number 45.48, edge 0.98. Check it: 45.48 − 44.5 = 0.98. Two for two. Both fully flat, both-market-consensus games on this board carry a real edge on at least one market.
Consensus answers one question; edge answers another
None of this proves our model is right. This slate hasn’t been graded yet, so there’s no settled record to point to either way (the full grading count is in the sourcing note below). What it does show, directly, on the two games this week’s board actually agrees on, is that “the books agree with each other” and “our model agrees with the books” are separate facts. One doesn’t imply the other. A flat board is real information about how tightly the market has converged. It isn’t, by itself, information about whether that converged number is our number too. Treating a flat line as proof there’s nothing left to find skips the actual comparison, our number against the line, that we just ran twice on the flattest games available.
The two edges look different next to each other, too. Atlanta-Pittsburgh’s spread edge, −0.56, is small enough that a single point of vig at any one book could plausibly swallow it. Its total edge, 1.85, and New England-Seattle’s total edge, 0.98, are each large enough to survive a single point of vig (the book’s built-in cut) at any one book. A flat consensus board doesn’t sort games into “has an edge” and “doesn’t” on its own. It just means the market side of the comparison is the same number everywhere you check it. That’s exactly what makes it a clean place to run this test.
For the full 16-game dispersion count this consensus subset was pulled from, see our companion board-quality piece. For live prices on every Week 1 game, see the NFL odds desk and NFL picks board. For the no-vig probability math behind any one of these lines, see understanding vig, juice and hold. If either line moves off flat before kickoff, that changes the setup here, so go check both boards again before you bet.

The Donk Check
I used to read a flat line as a green light to pass. That was the mistake. Flat means the books agree with each other. It says nothing about whether our number agrees with them. Both flat games this week still carry a real edge, and one of those edges, the Pittsburgh total, is big enough to actually mean something. Check the model against the line, not just the books against each other, and if either line moves off flat before kickoff, run this comparison again.