Updated Sep 7, 2026 · Week 1 board.
What SHAP actually explains, and what it does not
SHAP (a way of crediting which input moved a model's own number) answers exactly one question. Why did this model land here. It has nothing at all to say about why two different models landed in different places. Both can be built on Elo-style team ratings, weight what they're fed completely differently, and finish miles apart.
A model called “SHAP Explainable Elo Model” can walk you through its own arithmetic. Ask it about the model sitting one line below it in the table and it has no idea.
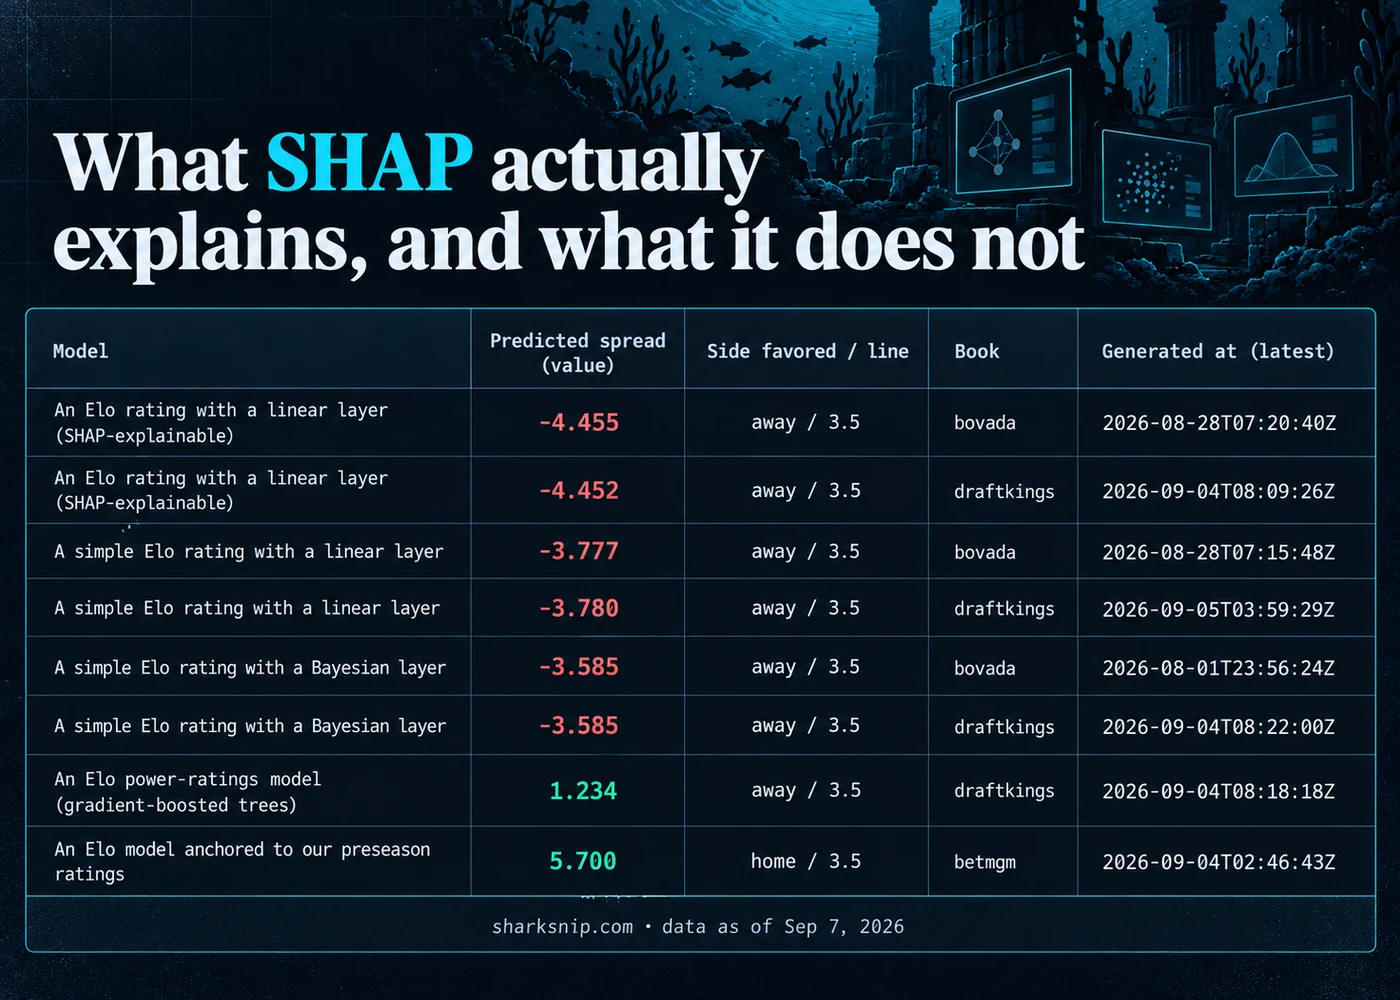
Eight Elo-family models, one game, one prediction shown per model
We hold 60 spread predictions on New England at Seattle, kickoff Sep 9, 2026 at 8:15 p.m. ET. Twelve of those come from models with “Elo” in their own names, and the twelve belong to eight distinctly named models. Several of the eight produced more than one prediction as their inputs were refreshed.
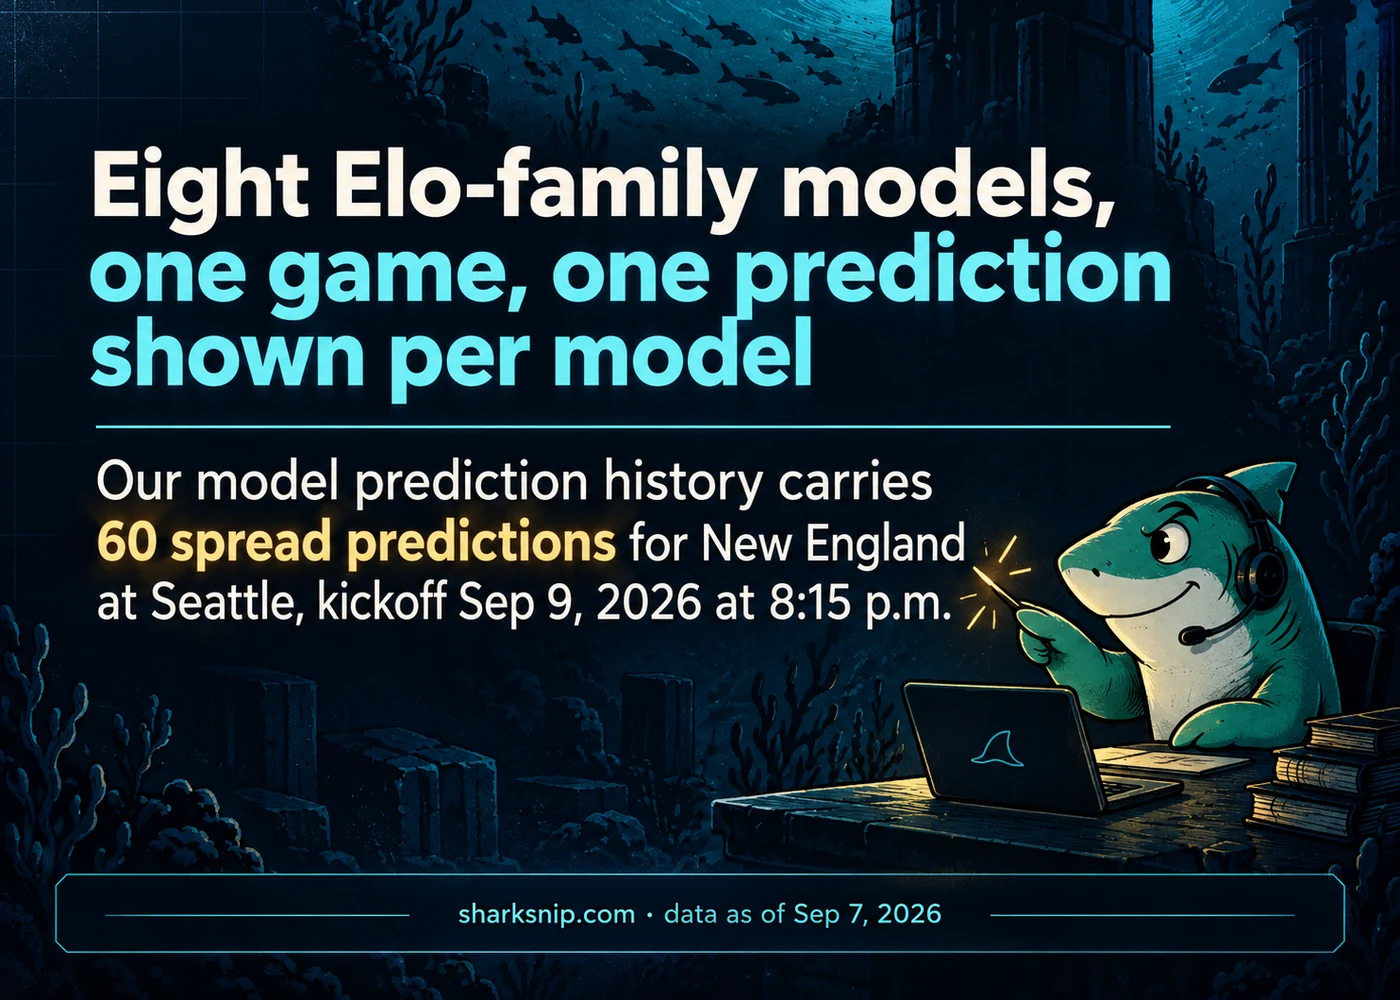
The table below shows one line per model, the most recent one in each case. I'm saying that dedup rule out loud instead of applying it quietly, because it decides which numbers you're looking at.
| Model | Predicted spread (value) | Side favored / line | Book | Generated at (latest) |
|---|---|---|---|---|
| An Elo rating with a linear layer (SHAP-explainable) | -4.455 | away / 3.5 | bovada | 2026-08-28T07:20:40Z |
| An Elo rating with a linear layer (SHAP-explainable) | -4.452 | away / 3.5 | draftkings | 2026-09-04T08:09:26Z |
| A simple Elo rating with a linear layer | -3.777 | away / 3.5 | bovada | 2026-08-28T07:15:48Z |
| A simple Elo rating with a linear layer | -3.780 | away / 3.5 | draftkings | 2026-09-05T03:59:29Z |
| A simple Elo rating with a Bayesian layer | -3.585 | away / 3.5 | bovada | 2026-08-01T23:56:24Z |
| A simple Elo rating with a Bayesian layer | -3.585 | away / 3.5 | draftkings | 2026-09-04T08:22:00Z |
| An Elo power-ratings model (gradient-boosted trees) | 1.234 | away / 3.5 | draftkings | 2026-09-04T08:18:18Z |
| An Elo model anchored to our preseason ratings | 5.700 | home / 3.5 | betmgm | 2026-09-04T02:46:43Z |
Three books agree on this game at -3.5. Pinnacle, DraftKings and Bovada, all sitting on the same number. The two SHAP-named predictions land just past the market on Seattle's side, at -4.455 and -4.452. The four “Simple Elo” predictions come in two matched pairs, each one built the same way twice.
The Linear pair is -3.777 and -3.780. The Bayesian pair came back at -3.585 both times it ran. So six of the eight are huddled around the market. Then there's “Elo Power Ratings (XGBoost)” at 1.234, which has crossed the street to the other side entirely, and “Preseason Prior (Elo)” at 5.700, liking New England by 5.7 points where every book and six of the other seven like Seattle.
Why sharing the word “Elo” does not mean sharing an answer
“Elo” names a family of rating systems. It does not name a number. A linear model, a Bayesian model, a gradient-boosted model and a hand-set preseason prior can all start from the same Elo-style rating and then combine it with different inputs, different priors, different loss functions. That is how you get a 10.155-point range on one football game.
Run SHAP against any one of those eight and it tells you which input pushed that model where it went, a home-turf adjustment, or a recent rating change. It still does not tell you why the tree version and the linear version disagree. That gap lives in how the two were built, and SHAP never looks there.
What this history actually contains, and what it does not
There is plenty inside each entry. The matchup, the season, the week, the kickoff time. An identifier for the prediction and for the model that made it. The model's own name, what kind of call it is, spread or total or moneyline, and when it was generated.
Which side it favors, the line it was measured against, the odds and the book behind that line, and how far the line has moved since. What is not in there is the part people assume is in there. No input names. No per-input credit.
Nothing that would let you rebuild a SHAP explanation for a single one of these predictions. The words “SHAP Explainable” inside a model's name describe how somebody built it. They do not mean the explanation ships alongside the number.
Reading a model label without over-claiming an explanation
A model's name is a label for its method. It is not a reading on how sure that model is, and it says nothing about how it gets along with its siblings. Look at the two Bayesian “Simple Elo” predictions. Both came back -3.585, a difference of 0.000, and that is the tightest pair on the board.
I enjoyed seeing it more than I should have. The two SHAP-named ones are nearly as tight, -4.455 and -4.452, a difference of 0.003. Then the widest two, 1.234 and 5.700, a difference of 4.466, sitting inside the same record on the same game with the same kickoff time as the twins. The word “Elo” does not close that gap.
SHAP does not close it either, even where you can genuinely run it.
The three-book market spread all of this is measured against is live at /odds. Our own published call on this game, and on every other Week 1 game, is at /picks/nfl. Everything above is a pre-kickoff number, model or market, with no grade attached to any of it yet. Once Week 1 is played, the settled grades turn up at /track-record.

The Receipts Drawer
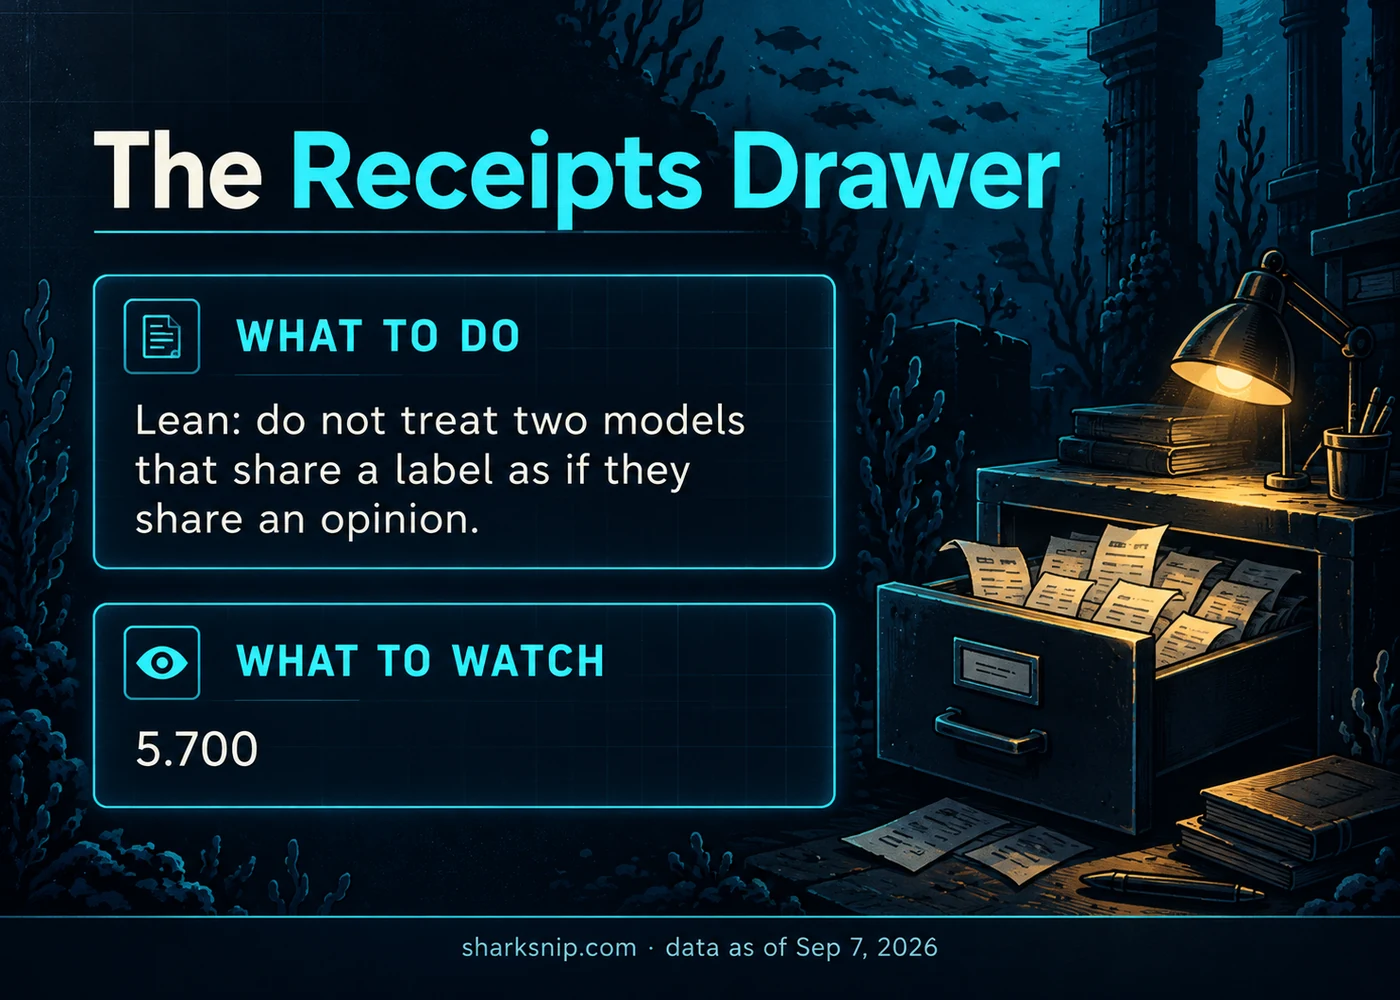
10.155 points between the widest two Elo-named models on one game, -4.455 against 5.700, while three books sit perfectly still at -3.5. Eight models sharing a name and spanning more than 10 points is not a rounding error. Only a graded result moves me off that. Nothing here has been settled, and on Sep 9 at 8:15 p.m.
ET the game starts answering for itself. So tonight, stop reading a shared word in a model's name as a shared opinion. And if you want to know why one of these eight landed where it did, go get that model's own SHAP output. The name on the front of it is never going to tell you.