
Updated Sep 7, 2026 · Week 1 board.
The matchup this title names isn't on the board this week
The Jets play at Tennessee. The Steelers host Atlanta. Neither game shows anything close to a 6-point swing. Jets at Titans ranges −1.5 to −1 across the three books, a 0.5-point gap. Falcons at Steelers is flat at −3.5 on all three, a 0.0-point gap. Whatever produced "Jets-Steelers, 6 points" in an earlier version of this page, it isn't on today's board. We're not inventing a matchup or a number to match that old title.
The real widest spread swing: Buffalo at Houston
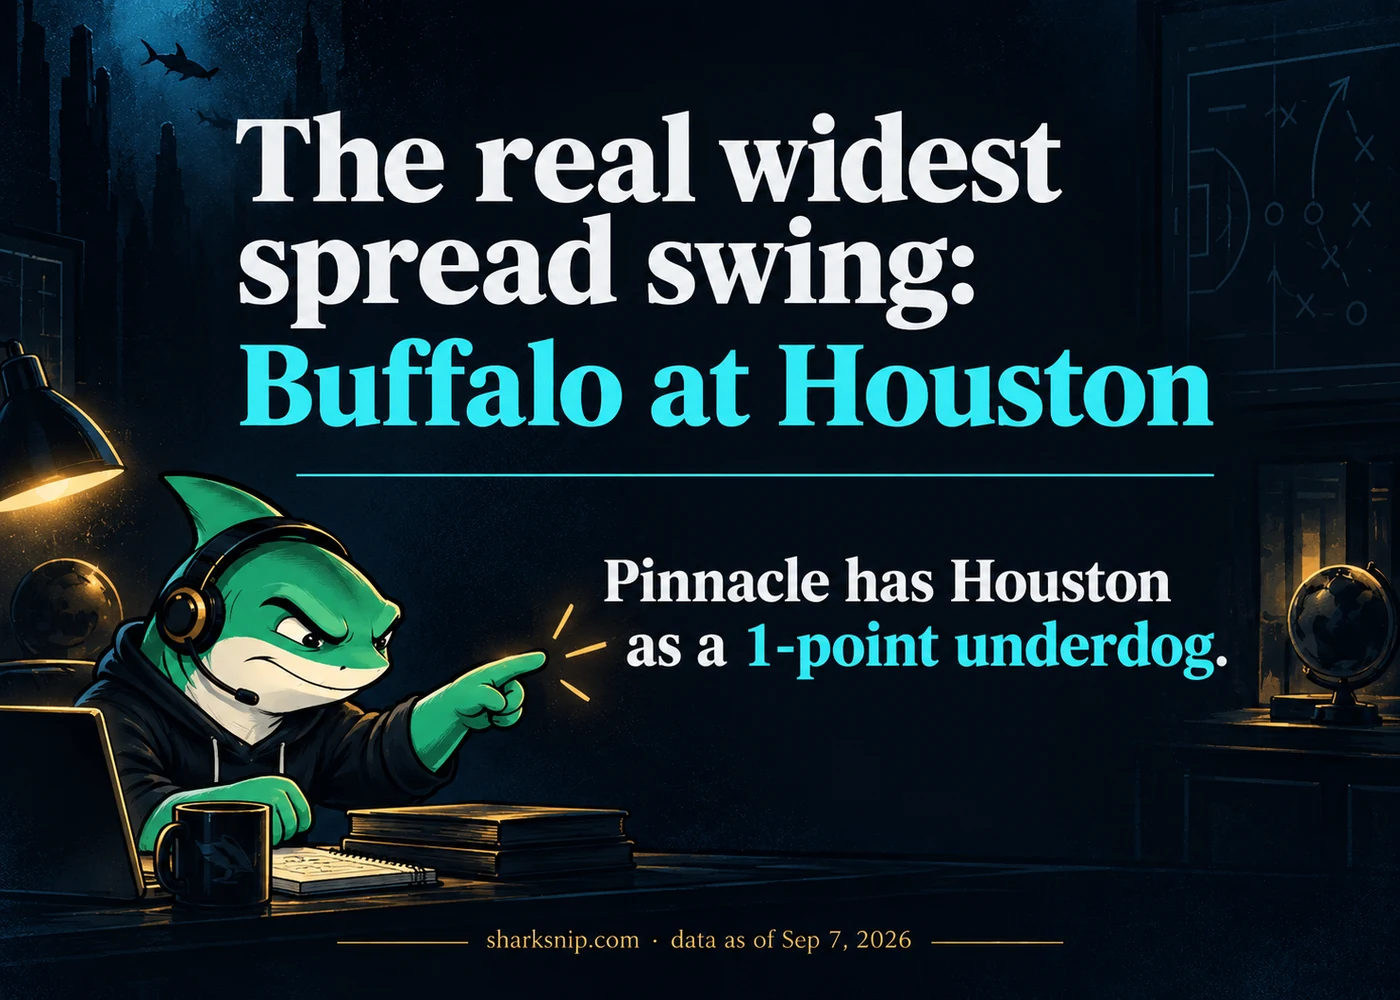
Pinnacle has Houston as a 1-point underdog. That's a home spread of +1, priced −115 and 103. DraftKings has Houston favored by a point and a half, at −1.5, priced 102 and −122. Bovada splits it at −1, priced −110 both ways. That's a 2.5-point swing and three different favorites on the same kickoff. It's the largest spread disagreement on the entire 16-game board.
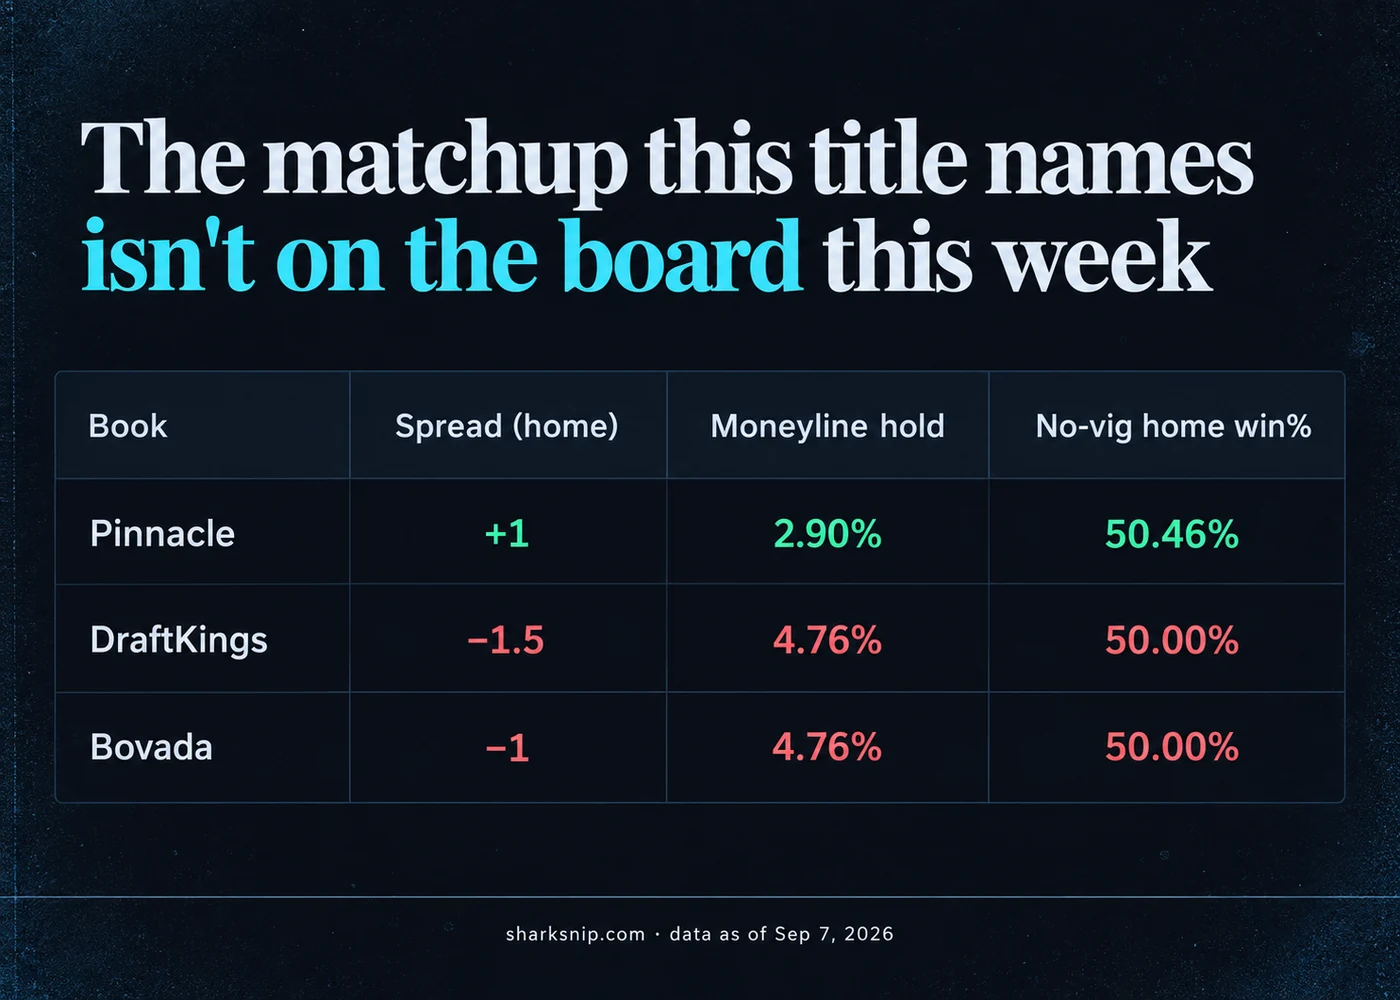
| Book | Spread (home) | Moneyline hold | No-vig home win% |
|---|---|---|---|
| Pinnacle | +1 | 2.90% | 50.46% |
| DraftKings | −1.5 | 4.76% | 50.00% |
| Bovada | −1 | 4.76% | 50.00% |
What an EV analytics price means, computed on this game
Take each book's moneyline. Convert it to an implied win chance. Then strip out the vig, the book's built-in cut, by scaling both sides so they sum to 100%. That turns a price into a fair number. Pinnacle's −108 and −104 imply a 50.98% to 51.92% split, a 2.9% hold (the same book cut as vig, just measured across both sides). Strip the vig and Houston's real chance is 50.46%. DraftKings and Bovada both post −110 both ways, a 4.76% hold, which strips to an even 50.00%. Pinnacle is the tightest-priced book here. Just under two points of hold separate it from the other two. That gap, between a book's raw price and its stripped fair price, is the entire mechanism behind an EV analytics price. It isn't a subscription number. It's implied win chance minus vig.
Two different kinds of disagreement
Bills-Texans is a disagreement about the number itself. Three books, three different point spreads. Compare that to Patriots at Seahawks, where every book agrees on the same −3.5, and still charges a different price for it. DraftKings' moneyline is −175. Bovada's is −185. A straight dime gap on an identical spread. That second kind of disagreement never shows up in a "how many books agree" count, because the number does agree. It only shows up once you price it. Bills-Texans mixes both. The number moves, and the price around each version of that number moves with it. An EV analytics price handles both cases the same way.
Where our model lands, and where it hasn't been tested
We run 37 different spread models on this matchup. The average projected home margin for Houston is +1.79, ranging from a 16-point road lean to a nearly 4-point home lean depending on the model. Our single published pick has Houston projected by 2.94 against DraftKings' −1.5 line, an edge of 4.44 points at 84.8% confidence (how likely our model thinks it is right). Our moneyline pick has Houston at a 58% win chance against a −102 price, an edge of roughly 7.5 points once the vig is stripped out. None of that is graded yet. That 37-model spread, from a 16-point road lean to a 4-point home lean on the same game, matters on its own. It means our read on this game is closer to a range than a single number. The published pick is one point drawn from that range, not a consensus of it.
Shop the exact numbers with the EV tool, read the mechanics behind hold and vig at understanding vig, juice and hold, and track how this spread keeps moving at how to read NFL line movement. Compare full book coverage at the book-shopping hold map, and see the live board at the odds page.

What the Number Says
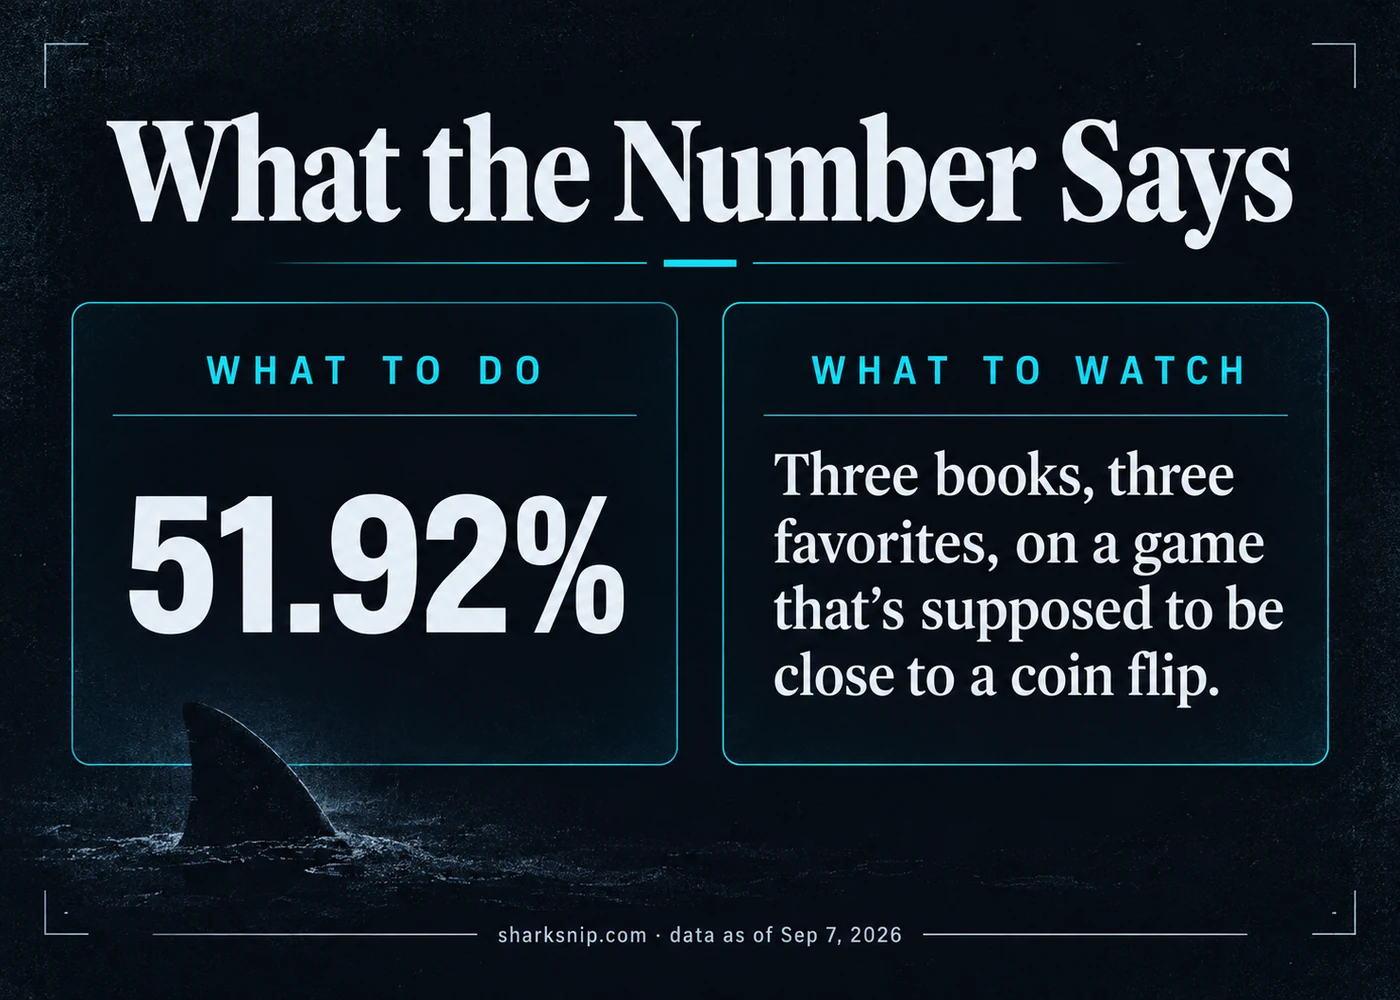
Three books, three favorites, on a game that's supposed to be close to a coin flip. That's the real headline this week, not a Jets-Steelers game that doesn't exist. Pinnacle is the tightest-priced book on Houston-Buffalo by almost two full points of hold. That's worth paying attention to on its own, price aside. Our own 37-model spread is wide enough that the published pick is one draw from a range, not a settled view. Watch this line into kickoff. If Pinnacle and DraftKings keep drifting apart, the shop-the-number case only gets stronger.