Updated Sep 7, 2026 · Week 1 board.
The two formulas, and why sign matters
Negative price: drop the minus sign, then divide the number by itself plus 100. Positive price: divide 100 by the number plus 100. Read the answer as a percent and you're holding the break-even win rate. That's what the side has to win for the ticket to come out flat at that exact price, before anybody takes out what the book keeps for itself.
Decimal odds are the same price wearing a different suit. Negative: 100 divided by the number, plus 1. Positive: the number divided by 100, plus 1.
A moneyline worked in full
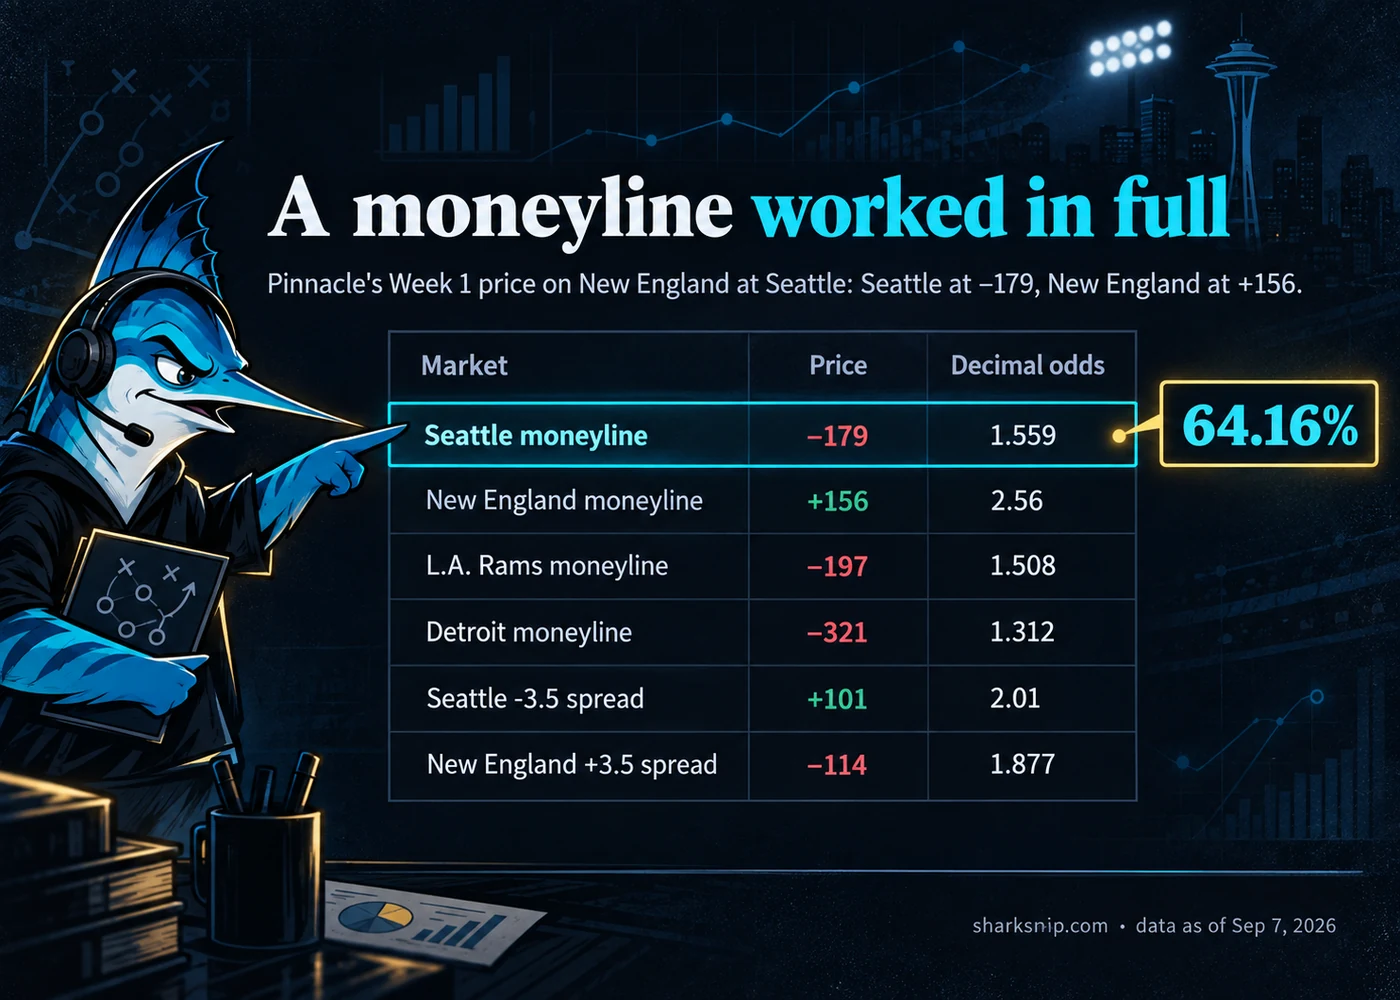
Pinnacle has New England at Seattle, with Seattle at −179 and New England at +156. Take Seattle first. 179 divided by 279 gives you 64.16%. New England is 100 divided by 256, which is 39.06%.
Add those two percentages together and you do not land on 100%. You land on 103.22%. That extra 3.22 belongs to the book, and something like it is sitting in every price you will ever be quoted. Divide both sides by that 103.22% and the padding comes off.
Seattle 62.16%. New England 37.84%. Those two add to exactly 100%.
The same method on a priced spread
Same two steps, same game, this time on the spread. Pinnacle has Seattle −3.5 priced at +101, and New England +3.5 priced at −114. Seattle at +101 is 100 divided by 201, or 49.75%. New England at −114 is 114 divided by 214, or 53.27%.
Those add to 103.02%, so the padding this time is 3.02. Take it off and Seattle sits at 48.29%, New England at 51.71%. Now look at what that says. Seattle is giving up 3.5 points on the scoreboard and still needs to win under 50% of the time to break even, because the plus-money price is pulling the opposite way from the minus-point spread.
Points and percentages are two separate numbers. Only the price turns into the second one.
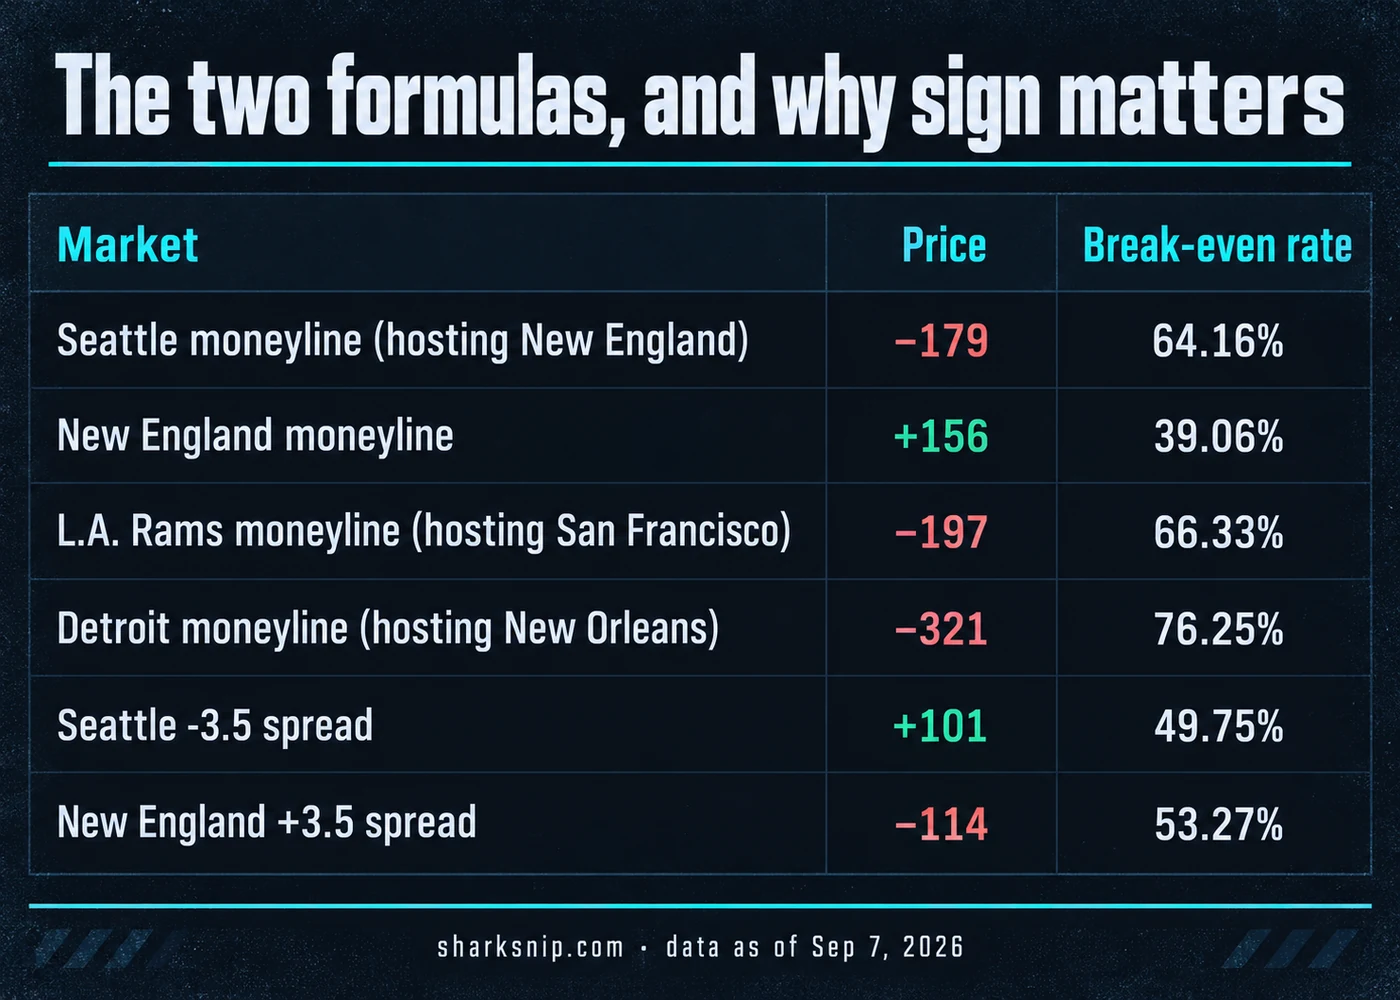
| Market | Price | Break-even rate |
|---|---|---|
| Seattle moneyline (hosting New England) | −179 | 64.16% |
| New England moneyline | +156 | 39.06% |
| L.A. Rams moneyline (hosting San Francisco) | −197 | 66.33% |
| Detroit moneyline (hosting New Orleans) | −321 | 76.25% |
| Seattle -3.5 spread | +101 | 49.75% |
| New England +3.5 spread | −114 | 53.27% |
The same six prices, written as decimal odds
A decimal number is not news. It's your break-even rate flipped over, and some books simply prefer to quote it that way.
−179 is 1.559. +156 is 2.56. −197 is 1.508.
−321 is 1.312. +101 is 2.01. −114 is 1.877.
Multiply your stake by that figure and you get everything coming back to you, stake included. Which is why you will never see one below 1.00.
A book that paid you back less than you risked on a winner would not be a book for long.
| Market | Price | Decimal odds |
|---|---|---|
| Seattle moneyline | −179 | 1.559 |
| New England moneyline | +156 | 2.56 |
| L.A. Rams moneyline | −197 | 1.508 |
| Detroit moneyline | −321 | 1.312 |
| Seattle -3.5 spread | +101 | 2.01 |
| New England +3.5 spread | −114 | 1.877 |
The two formats never disagree. Turn a decimal number upside down and out comes the same break-even rate the other formula hands you straight. So whichever way your book writes it, the win rate sitting underneath is the same win rate. Read whichever one you read faster, and stop giving the choice any thought at all.
Where the formula runs dry
The formula needs a price. A bare number won't feed it. Our college board carries a total and a spread for each of its 103 games and not one price anywhere on it. One sample game there shows a 3-point spread and a 54.5 total with nothing hanging off either one.
So there is no break-even rate to compute on that game, and I would not let myself invent one. The NFL board above works because every number on it, spread or moneyline, has a real price sitting beside it.
Run either formula against a live price in our odds converter. The board these prices came off sits at our main odds screen. The longer story on where that padding comes from lives in our explainer on vig and hold. A plainer walk through the formats themselves is in our odds-reading guide.
What happens when a spread turns up with nothing priced on it gets its own piece: why a spread alone can't be converted.

The Receipts Drawer
Seattle's honest number tonight is 62.16%. The screen says 64.16%, and the daylight between those two is what the book keeps for taking the bet. One price change and this arithmetic is stale. The moment Pinnacle comes off −179 both percentages move with it, and you can redo the arithmetic yourself in about ten seconds.
So redo it. Every price, every time, before the money leaves your hand. When a number starts to look generous to you, those ten seconds are the thing that tells you whether it really is.