If you spend any time around sports betting content, you will hear the phrase "ATS" thrown around constantly. The Bills are 8-2 ATS as a road favorite. The Lakers are 4-9 ATS at home this season. ATS is one of those acronyms that gets used as if everyone already knows what it means, and most beginners just nod along. This guide fixes that — what ATS means, how to read an ATS record, why the magic number is 52.4 percent, and how to actually use ATS data without fooling yourself.
The "against the spread" meaning
ATS stands for against the spread. It is a record that tracks how often a team beats the point spread, not the actual game. A team can win the game and lose ATS. A team can lose the game and win ATS. The straight-up score and the ATS result are independent.
Quick example: the Eagles are favored by 7 over the Cowboys. Jalen Hurts leads a 24-21 win. Philadelphia is 1-0 straight up but 0-1 ATS, because it did not cover the 7-point spread.
How an ATS record works
A team's ATS record looks like a normal win-loss line, but it tracks spread results:
- 9-3 ATS — covered the spread in 9 of 12 games, did not cover in 3.
- 9-3-1 ATS — the third number is pushes (when the final margin lands exactly on the spread). A push is a refund, not a win or a loss.
- 5-7 ATS as a home favorite — split by situation. ATS records can be sliced by home/road, favorite/dog, divisional/non, after a bye, and so on.
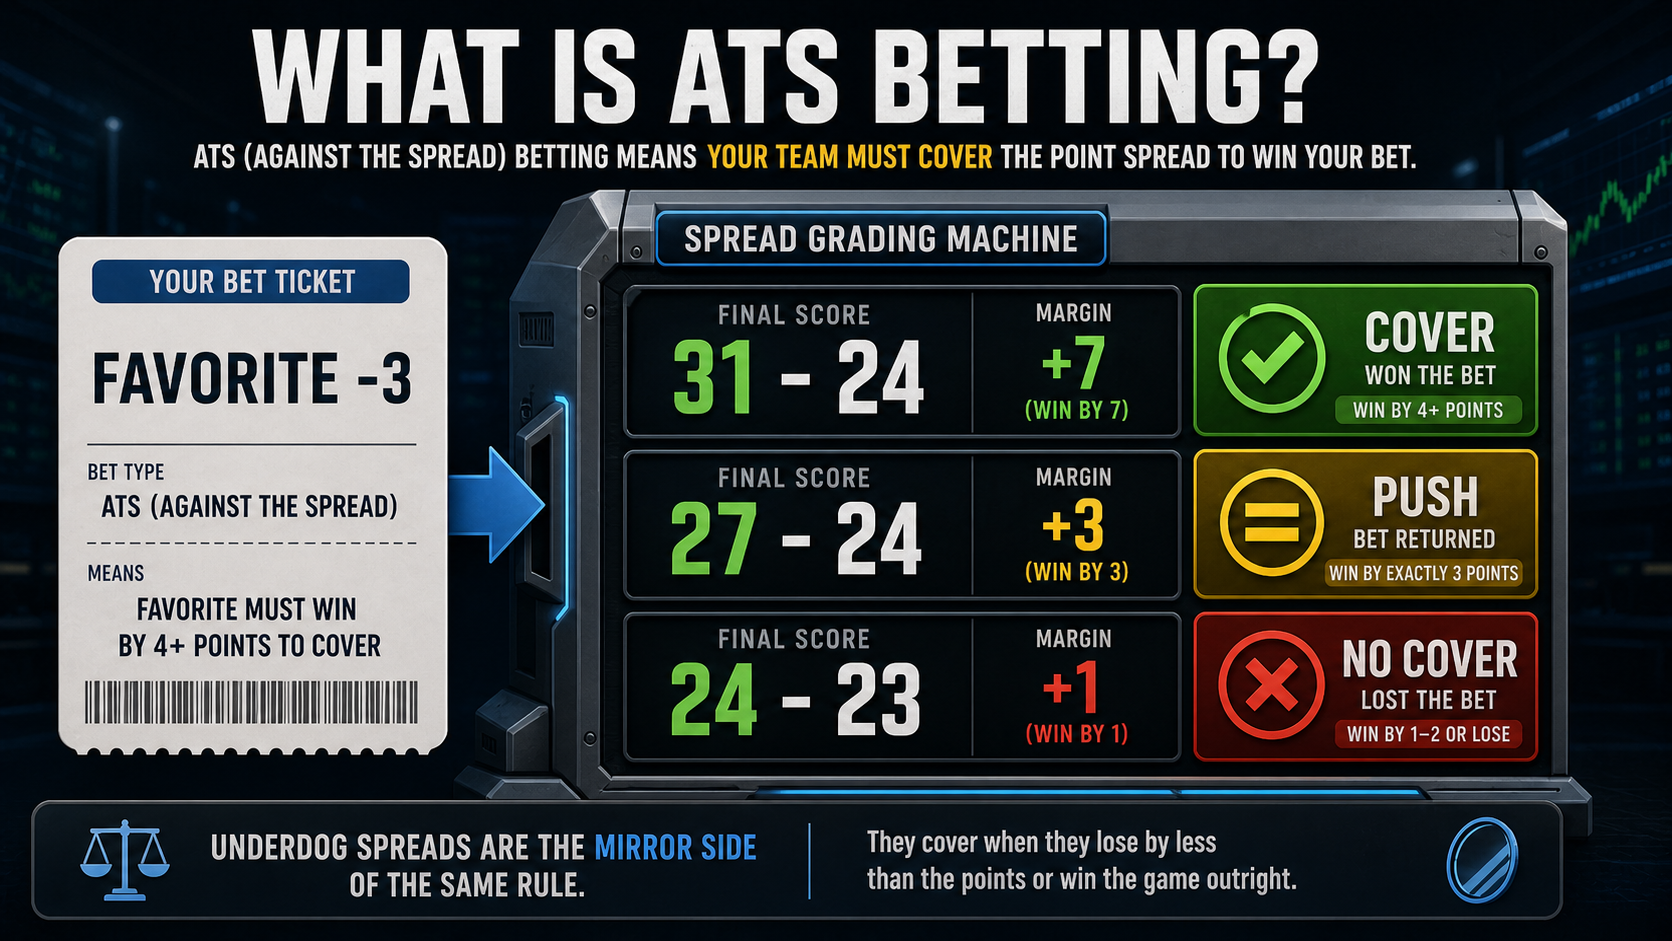
What counts as a cover
The favorite covers when they win by more than the spread. The underdog covers when they lose by less than the spread, or win outright. Pushes happen on whole-number spreads; half-point spreads (like -3.5) cannot push.
Why 52.4 percent is the number every spread bettor memorizes
Standard sportsbook juice is -110 on both sides of a point spread. That means you risk $110 to win $100, or $11 to win $10. To break even long-term, you need to win:
110 / (110 + 100) = 52.38%
Round it to 52.4%. Anything above that is profit. Anything below it is a leak. A bettor running 55 percent ATS over a meaningful sample is well into long-term profit territory. A bettor running 52 percent ATS is roughly break-even before considering tracking time, taxes, and tilt. A bettor running 48 percent ATS is bleeding 5 percent of every wager on average.
This is why "I am 9-7 this year" is not a brag. 9-7 is a 56.25 percent cover rate, which is great over a long sample but completely meaningless over 16 games — that is a coin flip with a tailwind.
How to read ATS splits without lying to yourself
ATS splits are the bread and butter of spread analysis, and also the easiest place to get tricked by small samples. Here is the rough sample-size hierarchy you should keep in your head:
- Under 30 games: noise. Useful for narrative, not for prediction.
- 30 to 100 games: directional. You can see tendencies but should not bet heavily on them.
- 100 plus games: meaningful. The sample is starting to overcome variance.
- 1,000 plus games: robust. League-wide splits over multiple seasons fall here.
"The Jets are 11-3 ATS off a loss the last three years" is a 14-game sample. Cool stat, but you would not retire on it. League-wide splits like "road favorites of 7+ points are X% ATS over the last 20 seasons" are far more trustworthy.
Concrete example: a full ATS picture
Imagine the Ravens have these splits through Week 12 with Lamar Jackson healthy:
- Overall: 7-4 ATS, 1 push
- As a favorite: 4-3 ATS
- As an underdog: 3-1 ATS
- On the road: 5-1 ATS
- After a loss: 3-1 ATS
What does this tell you? A few things. They are covering more often as underdogs and on the road, which is consistent with a team whose price the market keeps undervaluing. The home/road split (when paired with the favorite/dog split) is the most actionable. But 4 games as a road dog is still a small sample — you would want to confirm with their power rating, opponent quality, and travel context before betting it.
ATS and your own betting record
Your personal ATS record is the only one that pays you. Track every spread bet you make — Bills -3 with Josh Allen active, Bengals +4.5 with Joe Burrow questionable, 49ers -6.5 on a short week. At minimum, log:
- Date, sport, teams, spread, side, price (most spreads are -110, but you might shop -105)
- Result (win/loss/push) and ATS margin (how much you won or lost the cover by)
- Closing line — did the line move toward your side or away from it?
That last one is huge. Beating the closing line consistently — even by a half point per game — is the single best predictor of long-term profit. Read more on how to interpret line moves in our breakdown of sharp money vs public money, then track the result with a proper betting log.
Where ATS shows up in modeling
Every spread model is, at its core, an ATS prediction. The model outputs a projected margin (say -6.2), the book offers -4.5, and the model says to bet the favorite because 6.2 > 4.5 + 0.001. Track the cover rate by edge bucket and you have a real picture of what your model is worth. You can experiment with this directly in our spread model builder, which logs ATS results and cover rate by edge size on every backtest. The workshop walks through the same flow with prebuilt blocks if you would rather assemble than code.
The leaderboards on the creator marketplace are sorted by long-run ATS performance, not raw record. A modeler who beat 53.5 percent ATS over 800 documented bets ranks above someone hitting 58 percent over 40. Sample size matters because the audit is the product.
ATS by situation: where the real edges live
League-wide ATS records tell you almost nothing. Splitting them by situation is where the work starts to pay off. The categories that consistently produce predictive signal:
- Home dog vs road favorite. NFL home underdogs of 3 or fewer points have historically covered above 53 percent — a small but persistent edge the public underweights.
- Off a bye vs short week. Teams off a bye gain 1–2 points of effective spread value; teams on a Thursday following a Sunday lose roughly the same amount. The market accounts for this imperfectly.
- Divisional rematches. Second games against a division opponent inside a single season trend toward unders and toward the road team — familiarity tightens scripts.
- Backdoor cover risk. Heavy favorites (-10 or more) historically fail to cover at a higher rate than the public expects because late field goals and garbage-time touchdowns drag the final margin down.
None of these are automatic bets — they are starting points. Track each split inside your own data with a real sample (200+ games per split) before you trust them. The pattern that holds up across multiple seasons is the one worth betting; the pattern that looks great over 40 games is the one that breaks when you scale.
Practice spotting covers without staking
The fastest way to build ATS intuition is to play out scenarios with no real money on the line. The Gridiron auto-battler runs short simulated NFL drives and forces you to call cover/no-cover on each one with the spread visible. After 50 reps you start seeing the same key-number traps that bite live bettors — and the cost of being wrong is zero.
Common ATS mistakes
- Confusing record with profit. A 9-7 ATS record means very little without unit sizing. Three of those wins might be on -130 favorites that paid less than even.
- Reading recent ATS as predictive. "Hot" or "cold" ATS over 5 games is noise. The market already knows.
- Forgetting pushes. A team can be 7-7-2 ATS, which is exactly break-even excluding juice — useful info, not a trend.
- Comparing ATS records without context. A 10-2 ATS team that dodged every road game is not the same as a 10-2 ATS team that played the league's hardest schedule.
Bottom line
ATS — against the spread — is the only record that matters for spread bettors. To make money long term at standard -110 juice, you need a cover rate above 52.4 percent, and you need a meaningful sample to know whether you are actually there. Slice your splits carefully, track closing lines, and remember that small ATS samples are stories, not strategies.
If you are tracking your bets and beating the closing line consistently, the ATS record will follow. Browse current spread predictions and live ATS records on our NFL picks page, or keep building the foundation with how NFL spread lines work.
Bet responsibly — set limits, never chase losses.
Price examples and pass rules
Use names as evidence, not decoration. The useful SEO win is that Josh Allen, Lamar Jackson, Jalen Hurts, Joe Burrow and Ja'Marr Chase and Bills, Ravens, Eagles, Bengals and Cowboys appear inside decisions, thresholds, and internal links instead of being dumped into a keyword list.
- Spread example: if Chiefs-Broncos opens Chiefs -3.5 and your fair number is -2.8, +3.5 is the bet, +3 is a pass, and the moneyline needs roughly +155 or better before it replaces the spread.
- Total example: if a Bills outdoor total opens 46.5 and wind moves from 8 mph to 21 mph, an under projection at 42.8 still needs a playable number; under 45 or better is different from chasing 43.5.
- Futures example: Bengals AFC North +280 is 26.3% before hold. If your fair number is 30%, stake modestly, track portfolio correlation, and avoid stacking every Burrow, Chase, and Higgins bet into the same thesis.
- CLV rule: a good write-up is not enough. Track whether the spread, total, prop, or futures price closed better than your entry before grading the process.
Use closing-line value guide, vig and hold guide, bet tracking workflow to keep the examples attached to measurable prices.
Research note board
Use this table to turn the guide into a decision note. The point is to know when the idea is actionable and when it is only context.
| Angle | Input to verify | Example application | Pass when |
|---|---|---|---|
| Market price | Spread, total, moneyline, prop price, or futures hold | Bills and Ravens compared through hold | The price has moved past the number that created the edge |
| Football or sport context | Role, pace, weather, injury status, opponent style | Josh Allen role news mapped to the relevant market | The original input changes or remains unconfirmed |
| Review loop | Entry, close, result, and reason code | spreads logged with a clear thesis | You cannot explain whether the process beat the market |
NFL ATS cover-margin distribution
Distribution of (final margin − closing spread) across an NFL season. Roughly normal with mean ≈ 0 and standard deviation ≈ 13 points, which is why most ATS edges live in the ±1.5 point window.
Model calibration: predicted vs observed
Predicted win probability bucket vs the empirical win rate inside that bucket on the test set. Points on the y=x reference line are perfectly calibrated; points below mean the model is overconfident in that bucket.