NBA player props have exploded as the most popular bet type in the league, and it is easy to see why. They are personal — you bet on a player, not a team — and the lines are sharper for some prop types than others, which means real edges exist if you know where to look. This guide explains how to read NBA prop lines, what the over/under actually represents, how to interpret a PrizePicks board, and what factors actually move a player's projection.
What an NBA player prop is
A player prop is a wager on an individual stat line. Instead of betting on who wins the Lakers vs Celtics game, you are betting on whether LeBron James scores more or fewer than 24.5 points, or whether Jayson Tatum grabs more or fewer than 8.5 rebounds. The book sets a number — the line — and you bet the over or the under.
The most common NBA prop categories are:
- Points — easily the most bet, also the sharpest market.
- Rebounds — driven heavily by minutes and matchup.
- Assists — high variance; depends on team shooting and pace.
- Threes made — discrete and lumpy; binary outcomes per attempt.
- Combos — points + rebounds + assists (PRA), points + assists, and others.
- Steals, blocks, turnovers — low totals, high noise, often soft lines.
Over/under explained
The over/under is the single number the book offers as a midpoint of expected outcomes. If Luka Doncic's points line is 32.5, the book is saying it is roughly a coin flip whether he scores 33 or more (over) or 32 or fewer (under). The actual edge baked into that line varies by sport and book, but in NBA points the closing line is usually within half a point of the median outcome.
At a sportsbook, props are usually priced around -115 to -120 on both sides — slightly worse than spread juice. On daily fantasy apps like PrizePicks, the price is implied by the payout structure, which we will get to.
How to read a PrizePicks board
If you open the Gridiron dashboard or PrizePicks itself, every player tile shows three things:
- Player name and stat — for example, "Stephen Curry — Points".
- The line — the over/under number, like 26.5.
- Two buttons — "More" (over) and "Less" (under).
To enter a play, you build a parlay by selecting 2 to 6 picks. Each pick must hit for the parlay to win. PrizePicks pays out based on how many legs you select:
- 2-pick: 3x payout
- 3-pick: 5x or 6x
- 4-pick: 10x
- 5-pick: 20x
- 6-pick: 25x to 37.5x depending on contest
Standard-mode parlays require every leg to win. Flex mode pays a partial return if one or two legs miss but is priced lower. The implied edge per leg you need just to break even rises quickly with parlay size — a 6-pick at 25x means each leg needs to win at roughly 56 percent for break-even, which is brutal across six independent props.
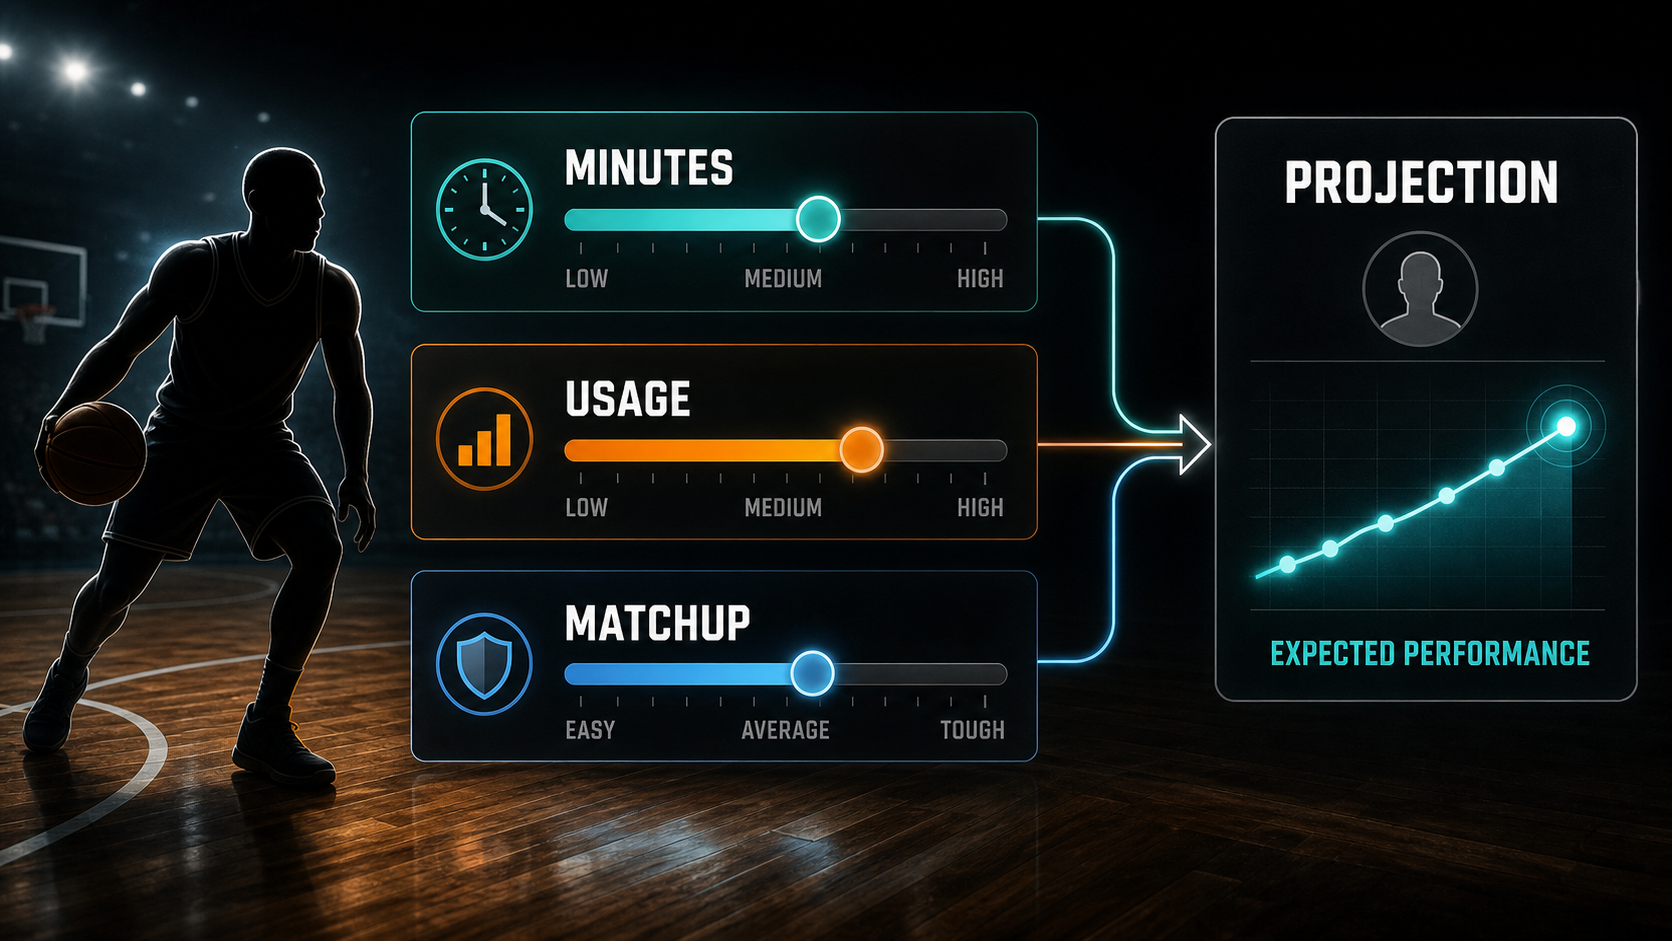
What actually moves a player's projection
The number on the screen is the result of a projection. To find edge, you have to know what the projection is actually a function of. The big drivers, in roughly the order they matter:
Minutes
This is the single biggest factor for almost every counting stat. A player who normally plays 34 minutes but gets bumped to 40 because of a teammate injury sees every counting stat scale roughly linearly. A 32.5-point line for a player suddenly playing 6 extra minutes might really be 36 or 37.
Pace
NBA pace varies from roughly 96 possessions per 48 minutes (slow) to 105 (fast). A 9-possession swing per game is huge for counting stats. Pace is a function of both teams; a fast team plus a fast team can produce 110+ possession games. Pace is the easiest factor for casual bettors to ignore and one of the most consistent edge drivers.
Matchup and on-ball defense
Some teams funnel offense to the rim (good for rebounds, bad for threes). Some teams switch every screen and erase mid-range looks. A center who normally takes 4 threes per game might shoot 7 against a team that defends drop coverage poorly.
Teammate availability
A point guard's assist line should jump when the team's two best shooters are healthy and crater when they are out. A scorer's points line should rise when the second-best scorer is out and the usage redistributes. Always read the injury report before betting any prop.
Game script
Blowouts kill props. A starter who plays 24 minutes in a 30-point win never sees the fourth quarter, and props built on a normal minute share crash. Tight games produce more starter minutes and more usage on top players.
A concrete example
Suppose the line is Devin Booker — Points 28.5. The Suns are at home against a team that ranks 28th in opponent points per shot at the rim, and Bradley Beal is out. Booker's usage rate has been 33% with Beal out, vs 28% when both are healthy. Phoenix's expected pace against this opponent is 102 possessions, slightly above Phoenix's season average.
That projection lifts. More minutes (Booker tends to log 38+ when Beal sits), higher usage, faster pace, weaker rim defense all push toward the over. The market may have moved the line to 30 already if it priced these factors in. If the line is still 28.5, that is a mispriced stat — the kind of thing a model is built to catch.
How to actually find prop edges
- Build per-minute baselines. Points per minute, rebounds per minute, assists per minute. Apply expected minutes to get a projection.
- Adjust for pace. Use the offensive and defensive pace of both teams.
- Adjust for matchup. Defense vs position, rim rate, three-point rate.
- Compare to the line. Difference of 1+ standard deviation is real edge. Anything inside half a point is noise.
- Track results by stat type. Some stat lines (rebounds, three pointers) are softer than others (points). Find the markets where your model has documented hit rates above break-even.
You can run this whole loop in the Shark Snip Workshop with prop-level features available out of the box. Spin up a fresh prop projection brick from /build/new, or fork a community prop model on the Marketplace to skip the setup work.
Common mistakes
- Stacking correlated unders. If you bet under on three Lakers points, a blowout helps all of them — but if it is a tight game, all three could go over.
- Ignoring the injury wire. A late scratch can move a line by 30 percent. The book updates faster than most bettors.
- Loading up huge parlays. A 6-leg PrizePicks slip needs every leg to hit roughly 56 percent of the time at 25x. The math is brutal.
- Trusting recent form too much. A player who scored 40 last game is likely to regress. A player who scored 8 in a blowout is not "due."
Bottom line
NBA player props are a stat-line bet driven by minutes, pace, matchup, and teammate availability. The line is a midpoint, not a prediction. To find real edge, build per-minute baselines, layer on pace and matchup, and only bet props where the gap between your projection and the line is large enough to overcome the implied vig. Skip the giant parlays unless you genuinely have correlated edge across legs.
If you are new to player props, start with single picks or 2-pick parlays, log every result, and figure out which prop types your reads are sharpest on. Read more strategy in the NBA player prop markets guide.
Bet responsibly — set limits, never chase losses.
NBA example board
Use the named prop board instead of a generic “good matchup” note. Nikola Jokic assist and rebound props should start with touch volume and whether Denver is using him as a hub. Shai Gilgeous-Alexander points props should start with free-throw equity, opponent rim pressure, and whether the market has already priced his usage. Luka Doncic PRA props, Jayson Tatum three-point volume, and Victor Wembanyama blocks or rebounds each need different inputs even when the headline market looks similar.
- Jokic assists: check teammate shooting availability, pace, and whether the defense sends help early.
- Shai points: separate true usage from a public star tax when the Thunder are heavily favored.
- Doncic PRA: watch blowout risk because rebounds and assists can disappear before points do.
- Tatum threes: price attempts, not only make rate, especially against switch-heavy defenses.
- Wembanyama blocks and rebounds: account for opponent rim attempts, foul risk, and minute stability.
How to keep NBA examples from going stale
Recheck the Celtics, Thunder, Nuggets, and Spurs context before acting because rotations move quickly around rest, injuries, and playoff leverage. The example is still useful if the player changes teams or the line changes, as long as the input stays explicit: minutes, usage, pace, matchup, and price. Pair this with reading NBA player props and NBA prop market structure when you need a deeper prop workflow.
Sport-specific model signals
Use names as evidence, not decoration. The useful SEO win is that Luka Doncic, Jayson Tatum, Nikola Jokic, Josh Allen and Ja'Marr Chase and Chiefs, Bills, Eagles and Lions appear inside decisions, thresholds, and internal links instead of being dumped into a keyword list.
- Prop EV example: Luka Doncic points or PRA at 32.5 should be checked against projected minutes, usage without key teammates, pace, spread, and back-to-back fatigue before price.
- MLB: a Dodgers at Rockies first-five total of 5.5 should account for starter xFIP, K-BB%, handedness, Coors Field run environment, wind, bullpen rest, and umpire zone.
- NHL: a Maple Leafs puck-line price at +160 needs confirmed goalie, 5v5 expected-goal share, special-teams edge, and empty-net probability before the margin bet makes sense.
- UFC: an Islam Makhachev-style grappling favorite needs takedown entries, control time, get-up rate, and submission exposure; an Alex Pereira-style striker needs knockdown equity and round-by-round cardio risk.
- DFS value example: NBA showdown builds need projected minutes, usage, salary, ownership, and late-swap flexibility before a star salary is worth paying.
- Stack example: an NBA same-game entry with Doncic points, teammate assists, and opponent threes needs one coherent pace script instead of three unrelated legs.
The goal is not to mention every star. It is to show how the model changes when the example changes from Doncic to Shohei Ohtani, Igor Shesterkin, Connor McDavid, or Tom Aspinall. Revisit and update the board when lineups, minutes, starters, goalie confirmations, weigh-ins, or market prices change.
Research note board
Use this board before clicking a prop, DFS build, or same-game entry. The table is intentionally about thresholds, not fake certainty.
| Step | Input | Example application | Cancel rule |
|---|---|---|---|
| Project the role | Snaps, routes, targets, carries, minutes, or usage | Luka Doncic volume against the posted line | The player loses the role that created the projection |
| Price the market | Break-even odds, line shopping, hold, payout structure | vig compared with sportsbook consensus | Juice or line movement removes the edge |
| Check correlation | Game script, teammate overlap, ownership, late news | Jayson Tatum paired with Chiefs script notes | The legs need different games to happen |
Prop OVER hit rate vs line distance from median
Empirical hit rate of OVER bets as the prop line moves away from the player projection median, measured in standard deviations. A line set 1sd below the median hits ~84% of the time — but books price the juice to match.
Breakeven win % at common American odds
The win rate you need to break even at each price. Pick odds shorter than -150 and you must win >60% just to stay flat — a hurdle most casual handicappers never sustain.