NHL spreads are different. The puck line is fixed at -1.5 / +1.5 for nearly every game, just like the MLB run line, but hockey scoring is even tighter than baseball. Two-goal margins are uncommon, late empty-net goals distort half the cover decisions, and overtime cuts off games at the moneyline result. This piece walks through how the puck line actually works, why it is harder to cover than the price suggests, and the matchups where laying -1.5 or taking +1.5 makes sense.
How the puck line works
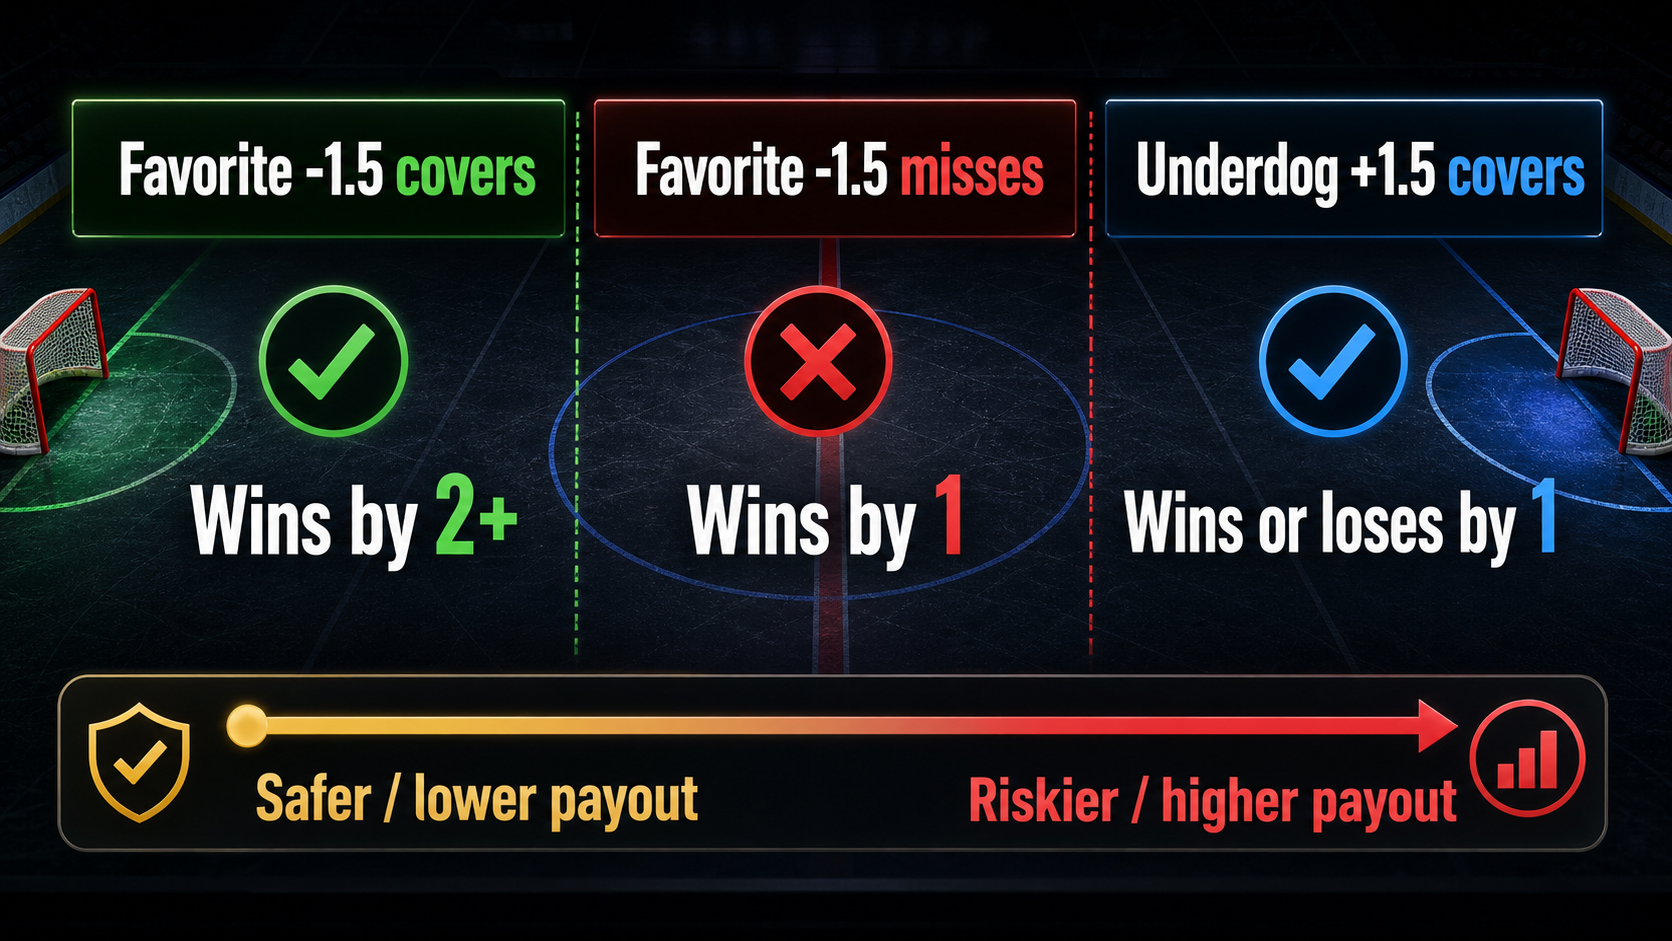
The puck line is a fixed -1.5 / +1.5 spread. The favorite must win by 2 or more goals to cover; the underdog covers if they win outright, lose by 1, or lose in overtime/shootout. Because hockey games end in regulation, OT, or shootout, the puck line includes all of those — the favorite needs a 2-goal regulation, OT, or shootout win.
- Heavy favorites at -1.5 typically pay even or plus money because covers are uncommon.
- Underdogs at +1.5 are usually priced -200 to -260 — the cushion is valuable in a low-scoring sport.
- Pick'em or small favorites at -1.5 pay big plus prices and rarely cover.
Why -1.5 is harder than it looks
The average NHL game has roughly 6 total goals. Two-goal margins are not rare, but they are not common either — about 35-40% of games end with a 2+ goal margin, including empty-net goals. Without empty-netters, the rate is closer to 30%.
That is the structural problem: the favorite has to outscore the opponent by 2 in a game where the average margin is between 0 and 2. The empty-net goal is what tips many puck-line covers. If the favorite holds a 1-goal lead with 90 seconds left, the opponent pulls the goalie, and either:
- The opponent scores to tie — favorite -1.5 loses.
- The favorite scores into the empty net — favorite -1.5 wins.
- Time runs out — favorite -1.5 loses (1-goal regulation win).
The empty-net coin flip is the dominant input on a meaningful share of puck line outcomes.
When laying -1.5 makes sense
The cleanest spots to lay -1.5 share three characteristics:
- The favorite is at home. Last change matters in hockey, and home favorites get matchup advantages that stretch leads.
- The favorite has a top-5 power play. Power play goals are the cleanest path to a 2-goal cover.
- The opponent has a backup goaltender. A backup playing his 8th game of the season is often a real downgrade — 0.5 goals against per 60 minutes worth.
If you are blending goalie quality and power play differential into a model, the model builder exposes goalie save percentage and special teams features.
A worked example
Suppose the Maple Leafs host the Sabres on a Saturday night. The Leafs' top goalie starts; the Sabres' backup is between the pipes. The Leafs' power play is 5th in the league; the Sabres' penalty kill is 25th. The Leafs' moneyline is -180; puck line -1.5 is +160.
The honest math: the Leafs win this game about 65% of the time. Of those wins, roughly half are by 2+ goals (special teams advantage, goalie advantage, home matchup edge). That is about 32-33% of total outcomes for a -1.5 cover. At +160, you need 38.5% — slightly under fair. The puck line is a marginal play.
Now adjust for empty-netters: in 1-goal favorite leads with under 2 minutes, the favorite scores into the empty net about 30% of the time, the opponent ties the score about 15%, and time runs out the other 55%. That empty-net upside takes the cover rate from 32% to about 36-37% — closer to fair on +160 but not value.
Underdogs at +1.5: the insurance market
Plus 1.5 in hockey is the safest spread bet on any board because of the regulation/OT/shootout coverage. Underdogs at +1.5 cover roughly 60-65% of games, which is why the price runs -200 to -260.
- If the underdog is at -250 on +1.5, you need 71% to break even — only the heaviest mismatches clear that bar.
- If the underdog is at -180 on +1.5, you need 64% to break even — closer to the structural cover rate, which is where value lives.
The puck line +1.5 sweet spot is the road underdog priced -180 to -200. They tend to lose tight games, get the OT loss point, and cover the cushion.
Goalie quality and the puck line
Goalie save percentage is the most important single input in the puck line market. A starter with a .920 save percentage versus a backup with .895 is roughly 0.6 goals per game in the favorite's favor. That alone shifts the puck line cover probability by 4-6 percentage points.
Three patterns the public consistently misses:
- Backup goalie announcements move the line slowly. The first 30 minutes after the announcement is the window before the closing line catches up.
- Hot goalies regress. A starter on a 3-game shutout streak is not the same goalie as his season-long save percentage.
- Cold goalies bounce back. A starter who has given up 4+ goals in three straight games usually rebounds toward his career average in the next outing.
For nightly goalie projections and starting lineup confirmations, see our NHL picks page for the matchup notes.
Special teams and the empty-net economy
Power play goals are the single most efficient path to a -1.5 cover. A team converting 25% of power plays in a game with 4 power plays scores roughly 1 power play goal — half a goal of expected value over the league average. Two-goal margins often hinge on whether the favorite cashes a power play.
Empty-net goals scored late in games are about 7% of all NHL goals. They are over-represented in puck line covers because they almost always extend a 1-goal lead to 2 (or vice versa). Sharp puck line bettors price empty-net probability into their cover models explicitly.
Common mistakes in puck line betting
- Betting -1.5 on a road favorite without home-ice context. Road favorites are penalized by losing the matchup-line advantage.
- Taking +1.5 at -250. The implied probability is too high — most games do not have that level of mismatch.
- Ignoring goalie news. A backup announcement is the largest single input on any night's puck line.
- Forgetting OT/SO coverage. Underdog +1.5 wins on overtime losses and shootout losses, which is a non-trivial share of all NHL games.
How to read puck lines in your workflow
The cleanest workflow: project the moneyline win probability, project the conditional 2-goal margin probability separately, then derive the puck line. For underdogs, project the probability of "win, OT loss, or 1-goal loss" combined.
For ongoing puck line model projections and per-team cover-rate trends, see the NHL picks board, the model leaderboards for which models score best on the puck line market, the empty-net totals guide for related game-state content, and the live gridiron grid for tonight's puck-line edges.
Special teams: the puck-line tiebreaker
Power-play percentage gap is the single most useful special-teams input for puck-line modeling. A team converting 25% of power-play opportunities with 4 chances scores roughly 1 PP goal — half a goal of expected value over the league average. That alone changes a 1-goal projected lead into a 2-goal cover. Penalty kill matters slightly less but compounds: a team allowing 22% PP rates while opponent converts 25% is giving up roughly 1.2 PP goals per game in net special-teams variance, which is the entire margin between -1.5 covering and not.
The cleanest puck-line plays sit at the intersection of a top-5 power play and a bottom-10 opposing penalty kill, with the favorite at home and the favorite's starter on full rest. Those four conditions together push the cover rate above 50% — a clear lay even at -110 or worse pricing. The reverse spot (opponent has the special-teams edge, favorite is the away side on a back-to-back) flips +1.5 into a high-conviction buy at -180.
Building a puck-line model that holds up
A bare-bones puck-line model with five inputs — goalie SV% gap, power-play gap, penalty-kill gap, home-ice indicator, and back-to-back flag — beats the closing line at sharp books over a full season at about 53-54%. That is enough to print at -110 vig. Adding starter rest, road-trip length, and "elite forward back from injury" flags pushes it to 54-55%. Fork the puck-line template in the workshop, validate on the trailing season, and publish your version to the marketplace if it holds against the field.
Related reading
Puck-line strategy pairs naturally with the goalie-confirm guide (late-day edges on backup announcements) and the empty-net totals piece (how late ENGs distort live unders and team totals). Together they cover the three biggest moving pieces of an NHL bet card: the spread, the goalie news, and the late-game empty-net economy.
Bottom line
The NHL puck line is a margin bet in a sport that rarely produces clean margins. Lay -1.5 when the home favorite has a goalie edge, a special teams edge, and a backup-quality opponent in net. Take +1.5 in the -180 to -200 range — the structural cover rate beats the implied probability. Above all, watch goalie news: it is the single biggest line mover in the entire NHL board.
Bet responsibly — set limits, never chase losses.
NHL example board
NHL betting gets sharper once the goalie and shot-profile examples are named. Igor Shesterkin and Connor Hellebuyck are useful starter-confirmation examples because the move can touch moneylines, puck lines, team totals, and saves props at different speeds. Connor McDavid and Nathan MacKinnon are shot-volume examples where one elite skater can change power-play expectations and empty-net math even when the full-game total barely moves.
- Goalie confirmation: compare the starter upgrade to the moneyline and total move, not just the headline name.
- Puck line: decide whether the favorite can create margin without needing an empty-net goal.
- Totals: watch whether the Oilers, Panthers, or Jets profile points to pace, power-play pressure, or a low-event game.
- Saves props: do not bet volume without checking shot quality and whether the underdog can keep the game competitive.
NHL update rules
The best NHL pages need a late-news checklist because morning-skate information is often incomplete. Revisit goalie confirmations, line rushes, power-play units, travel fatigue, and empty-net incentives before locking in. The companion workflows are goalie confirmation edges and same-game parlay correlation.
Sport-specific model signals
Use names as evidence, not decoration. The useful SEO win is that Josh Allen, Ja'Marr Chase, Bijan Robinson and Puka Nacua and Chiefs, Bills, Eagles and Lions appear inside decisions, thresholds, and internal links instead of being dumped into a keyword list.
- Prop EV example: Luka Doncic points or PRA at 32.5 should be checked against projected minutes, usage without key teammates, pace, spread, and back-to-back fatigue before price.
- MLB: a Dodgers at Rockies first-five total of 5.5 should account for starter xFIP, K-BB%, handedness, Coors Field run environment, wind, bullpen rest, and umpire zone.
- NHL: a Maple Leafs puck-line price at +160 needs confirmed goalie, 5v5 expected-goal share, special-teams edge, and empty-net probability before the margin bet makes sense.
- UFC: an Islam Makhachev-style grappling favorite needs takedown entries, control time, get-up rate, and submission exposure; an Alex Pereira-style striker needs knockdown equity and round-by-round cardio risk.
- DFS value example: NBA showdown builds need projected minutes, usage, salary, ownership, and late-swap flexibility before a star salary is worth paying.
- Stack example: an NBA same-game entry with Doncic points, teammate assists, and opponent threes needs one coherent pace script instead of three unrelated legs.
The goal is not to mention every star. It is to show how the model changes when the example changes from Doncic to Shohei Ohtani, Igor Shesterkin, Connor McDavid, or Tom Aspinall. Revisit and update the board when lineups, minutes, starters, goalie confirmations, weigh-ins, or market prices change.
Research note board
Use this table to turn the guide into a decision note. The point is to know when the idea is actionable and when it is only context.
| Angle | Input to verify | Example application | Pass when |
|---|---|---|---|
| Market price | Spread, total, moneyline, prop price, or futures hold | Chiefs and Bills compared through vig | The price has moved past the number that created the edge |
| Football or sport context | Role, pace, weather, injury status, opponent style | Josh Allen role news mapped to the relevant market | The original input changes or remains unconfirmed |
| Review loop | Entry, close, result, and reason code | hold logged with a clear thesis | You cannot explain whether the process beat the market |
NFL ATS cover-margin distribution
Distribution of (final margin − closing spread) across an NFL season. Roughly normal with mean ≈ 0 and standard deviation ≈ 13 points, which is why most ATS edges live in the ±1.5 point window.
Model calibration: predicted vs observed
Predicted win probability bucket vs the empirical win rate inside that bucket on the test set. Points on the y=x reference line are perfectly calibrated; points below mean the model is overconfident in that bucket.