If you have spent any time on an MLB betting board, you have seen the F5 markets sitting next to the full-game lines. First 5 innings betting is one of the most underrated wagers in baseball, and it is where a lot of professional money quietly lives. The reason is structural: an F5 bet strips a huge source of variance — the bullpen — out of the equation, leaving you to evaluate something far more predictable. This post walks through how the markets work, why they exist, and the angles where models tend to find consistent edge.
What a first 5 innings bet actually is
An F5 bet settles based on the score after 5 complete innings rather than the full 9. Every major book offers three core F5 markets:
- F5 moneyline — which team is leading after 5.
- F5 run line — usually -0.5 / +0.5, sometimes -1.5 / +1.5 in mismatched games.
- F5 total — over/under on combined runs through 5 innings.
If the game is tied after 5, the F5 moneyline pushes (some books offer a "no tie" three-way market with juice). The run line and total settle exactly like full-game markets, just with the 5-inning cutoff.
Why the bullpen problem makes F5 cleaner
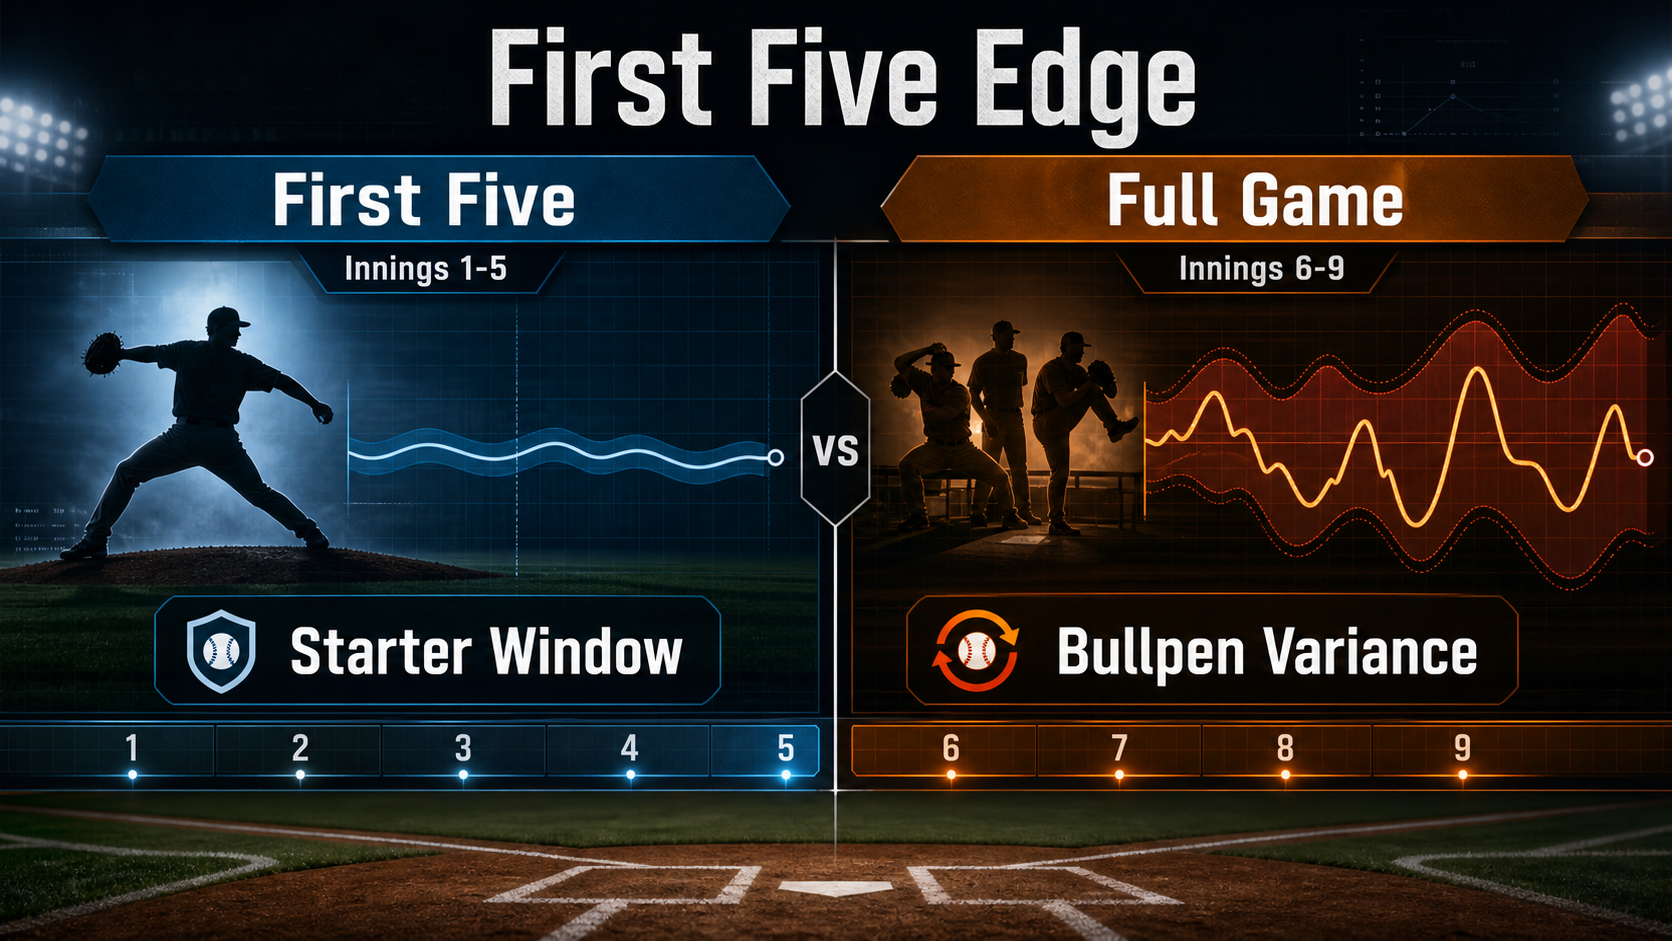
Modern MLB games are decided by relief pitching as much as by starters. A team with the best starter on the slate can still lose because their middle reliever gives up a 3-run homer in the 7th. From a modeling standpoint, that is awful — bullpen variance is huge, the sample size on individual relievers is small, and matchup-by-matchup leverage decisions move the win probability dramatically.
F5 bets cut all of that out. The starting pitcher typically goes 5 to 6 innings. The full bullpen rarely enters the picture. What you are left with is a head-to-head matchup of two starters and a top-of-the-order vs top-of-the-order at-bat sequence. Those are inputs that actually have signal: pitcher xFIP, hard-hit rate allowed, recent velocity trends, opponent OPS vs the relevant handedness. The closing F5 line tends to reflect a much narrower distribution of outcomes than the full-game line.
Where the edge lives
1. Bullpen-fade situations
If you have correctly identified that Team A has the better starter but a wreck of a bullpen, the full-game line forces you to cross your fingers for 9 innings. The F5 line lets you bet the part you actually have a read on. Conversely, when a team has a strong bullpen but a back-end starter going against an ace, fading them in F5 (and possibly taking them on the full game) is a coherent strategy.
2. Lineup construction matters more
The first five innings cover roughly two trips through the order for the top of the lineup and one to two for the bottom. Teams that stack their best hitters in spots 1-4 generate disproportionate F5 production. A lineup with three legitimate top-of-the-order bats vs a lineup that hides its production in spots 5-8 is a real F5 angle, even when full-game projected runs are similar.
3. Park and weather effects clarify
F5 totals respond to wind, temperature, and park factor in cleaner ways than full-game totals because relief pitching is removed. Coors at altitude with the wind blowing out is an F5 over angle every time. A pitcher's park with a 12 mph wind blowing in is an under angle — and the F5 number tends to be a half-run softer-priced than the equivalent full-game read, because the public bets the full game.
A worked example with concrete numbers
Suppose the full-game line is:
Dodgers -1.5 (+105) at Rockies +1.5 (-125), Total 11.5
And the F5 line is:
Dodgers -0.5 (-130) at Rockies +0.5 (+110), F5 Total 5.5
The full-game over implies about 11.5 runs in 9 innings, or 1.28 runs per inning. The F5 total implies 5.5 runs in 5 innings, or 1.1 per inning. That gap is the market's expectation that bullpens give up runs at a higher rate than starters — historically true in aggregate. But on a day when the Dodgers' bullpen is rested and dominant while the Rockies' bullpen is on day 4 of a stretch, the gap should be wider. If your model says full game settles at 12 but F5 settles at 5.7, you have a tiny edge on the F5 over without taking on the bullpen-blowup risk that haunts full-game unders.
How sharps actually deploy F5 bets
The most common professional pattern is using F5 as a hedged or correlated leg with full-game positions. A few examples:
- F5 favorite, full-game underdog — bet on the better starter to lead at 5, then the other team to come back over 9. This works when one team has a starter advantage and the other has a bullpen advantage.
- F5 over, full-game under — runs early, scoring dries up late as both managers navigate the leverage innings carefully.
- F5 only — you have a strong read on the starter matchup but no real opinion on the bullpens.
None of these are gimmicks. They reflect the fact that an MLB game is two distinct phases of pitching, and the markets price them together. If you can split the read, the F5 line is your tool. You can browse current model picks for both full-game and F5 markets on our MLB picks page, and back-test starter-only models in the workshop against historical closing F5 lines.
How public F5 mistakes feed the line
The retail F5 audience is much smaller than the full-game audience, but the public money that does show up follows three predictable patterns:
- Public bets the F5 over on the marquee starter matchup. When two aces face off, recreational money piles onto F5 unders because "low total" feels safe. The number gets pushed too low, and the structural over (with bullpens still pitching 3 innings between them) becomes the value side.
- Public bets the heavy F5 favorite on name brand. A Cy Young winner at -180 F5 ML is the same chalk in F5 as the full game, but the F5 cover requires 5 innings of dominance against a top-of-the-order that gets two looks at the pitcher. Two trips through the order is exactly when ace performance drops.
- Public bets F5 to "reduce risk." Lower variance is not lower vig. A -120 F5 ticket needs 54.5% to break even — that is a real bar, and a "this team has a better starter" gut read does not clear it.
If you can identify which side the public is forcing the line, the F5 product gives you cleaner counter-bets than the full game does.
Common mistakes
- Betting F5 because "it has less variance" without an actual edge. Lower variance does not mean profitable. You still need a read on starter quality, lineup, and park.
- Ignoring weather updates. First-pitch wind is the relevant input for F5 totals. A 12 mph wind blowing out at first pitch can drop to 5 mph by the 7th — the F5 total cares about the early conditions.
- Treating the F5 line as a fraction of the full game. Books sharpen F5 separately. Do not assume "5/9 of the full total" is the right F5 number; that is exactly the assumption sharper money exploits.
- Pushing through small edges. F5 lines often run -120 / +100 with juice baked in. A 1% theoretical edge gets eaten by a -120 ticket. Demand a real margin.
Where to look for F5 edge each day
Three filters cover most of the opportunity:
- Starter ERA gap of more than 1.50 between the two pitchers, with the worse pitcher's team having a strong recent bullpen — F5 favorite, full-game look.
- Park factor + weather extremes — Coors with wind out, Yankee Stadium with wind to right, Petco with marine layer rolling in.
- Lineup heavy at the top — three or four legitimate hitters in the first four spots vs a lineup that buries production lower.
Bottom line
MLB first 5 innings betting is the cleanest version of baseball wagering for anyone who wants to remove bullpen variance from their model. The F5 lines reward starter analysis, park-and-weather inputs, and lineup construction reads. They penalize lazy "fraction of the full game" thinking and small edges paid out at -120 juice.
If you are starting out, treat F5 markets as a way to express a specific belief about the early innings rather than a generic "less risky" version of the full-game bet. For ongoing model picks, F5 totals, and run lines, see our MLB picks page, the model leaderboards for top F5 builders, and the gridiron live matchup grid for tonight's edges.
F5 vs the full-game run line
F5 is not a substitute for the full-game run line — they price different things. The run line is a 9-inning margin bet that asks whether the favorite wins by 2; F5 is a 5-inning lead bet that mostly asks whether the better starter held serve through two trips of the order. The cleanest workflow is to read both: if your model says the favorite is a 65% ML and a 35% -1.5 cover, but their starter projects 90% to lead at 5, the F5 ML at -150 is a better expression than the -1.5 at +130. If both numbers point to a 2-run game, the full-game -1.5 is the play. Comparing the two markets side-by-side is how sharps separate "team is better" from "team will dominate the early innings."
Related reading and next steps
If you came here from the basics, the MLB run lines explained guide pairs naturally with this one — read them together to build the full margin-vs-leadership picture. To put it into practice, fork a starter-heavy template in the workshop, surface your edges on the marketplace if you want to publish, or compare your projections against the field on leaderboards.
Bet responsibly — set limits, never chase losses.
MLB example board
A baseball betting read needs names because starter, lineup, park, and umpire inputs can move the number before the public sees the reason. Shohei Ohtani, Aaron Judge, and Juan Soto are clean examples for lineup gravity because one premium bat can alter run expectancy, opposing bullpen choices, and same-game prop pricing. Tarik Skubal and Spencer Strider are starter examples where strikeout ceiling, pitch count, and opponent handedness can matter more than the season-long team record.
- First five innings: isolate the starter matchup before bullpen quality muddies the handicap.
- Starter scratch: separate true downgrade from book cleanup after the market overreacts.
- Park factor: Coors Field, Camden Yards, and Petco Park should not be treated like the same run environment.
- Lineup news: Ohtani, Judge, or Soto availability can move both full-game totals and hitter props.
MLB update rules
The article should be updated when a confirmed lineup, starter change, roof status, umpire assignment, or weather shift changes the edge. For related workflows, use MLB first-five betting and closing-line value to decide whether the move created value or simply erased it.
Sport-specific model signals
Use names as evidence, not decoration. The useful SEO win is that Josh Allen, Ja'Marr Chase, Bijan Robinson and Puka Nacua and Chiefs, Bills, Eagles and Lions appear inside decisions, thresholds, and internal links instead of being dumped into a keyword list.
- Prop EV example: Luka Doncic points or PRA at 32.5 should be checked against projected minutes, usage without key teammates, pace, spread, and back-to-back fatigue before price.
- MLB: a Dodgers at Rockies first-five total of 5.5 should account for starter xFIP, K-BB%, handedness, Coors Field run environment, wind, bullpen rest, and umpire zone.
- NHL: a Maple Leafs puck-line price at +160 needs confirmed goalie, 5v5 expected-goal share, special-teams edge, and empty-net probability before the margin bet makes sense.
- UFC: an Islam Makhachev-style grappling favorite needs takedown entries, control time, get-up rate, and submission exposure; an Alex Pereira-style striker needs knockdown equity and round-by-round cardio risk.
- DFS value example: NBA showdown builds need projected minutes, usage, salary, ownership, and late-swap flexibility before a star salary is worth paying.
- Stack example: an NBA same-game entry with Doncic points, teammate assists, and opponent threes needs one coherent pace script instead of three unrelated legs.
The goal is not to mention every star. It is to show how the model changes when the example changes from Doncic to Shohei Ohtani, Igor Shesterkin, Connor McDavid, or Tom Aspinall. Revisit and update the board when lineups, minutes, starters, goalie confirmations, weigh-ins, or market prices change.
Research note board
Use this table to turn the guide into a decision note. The point is to know when the idea is actionable and when it is only context.
| Angle | Input to verify | Example application | Pass when |
|---|---|---|---|
| Market price | Spread, total, moneyline, prop price, or futures hold | Chiefs and Bills compared through vig | The price has moved past the number that created the edge |
| Football or sport context | Role, pace, weather, injury status, opponent style | Josh Allen role news mapped to the relevant market | The original input changes or remains unconfirmed |
| Review loop | Entry, close, result, and reason code | spreads logged with a clear thesis | You cannot explain whether the process beat the market |
Average total points by weather bucket
Average combined points scored in NFL games by weather bucket over recent seasons. Wind above 20mph and snow each clip totals by 6-8 points vs domed games, which is why books move totals aggressively when forecasts shift.
NFL ATS cover-margin distribution
Distribution of (final margin − closing spread) across an NFL season. Roughly normal with mean ≈ 0 and standard deviation ≈ 13 points, which is why most ATS edges live in the ±1.5 point window.