Updated Sep 7, 2026 · Week 1 board.
The ID number that makes this work
nflverse's players.csv holds one entry per player. An ID number, the player's name, position, current team, and draft details. It's refreshed regularly as part of nflverse's public data releases. It carries no odds, no lines, no market data of any kind. It's a roster lookup, full stop. The ID column is what makes it useful downstream. It's the NFL's own player identifier, formatted like 00-0036158.
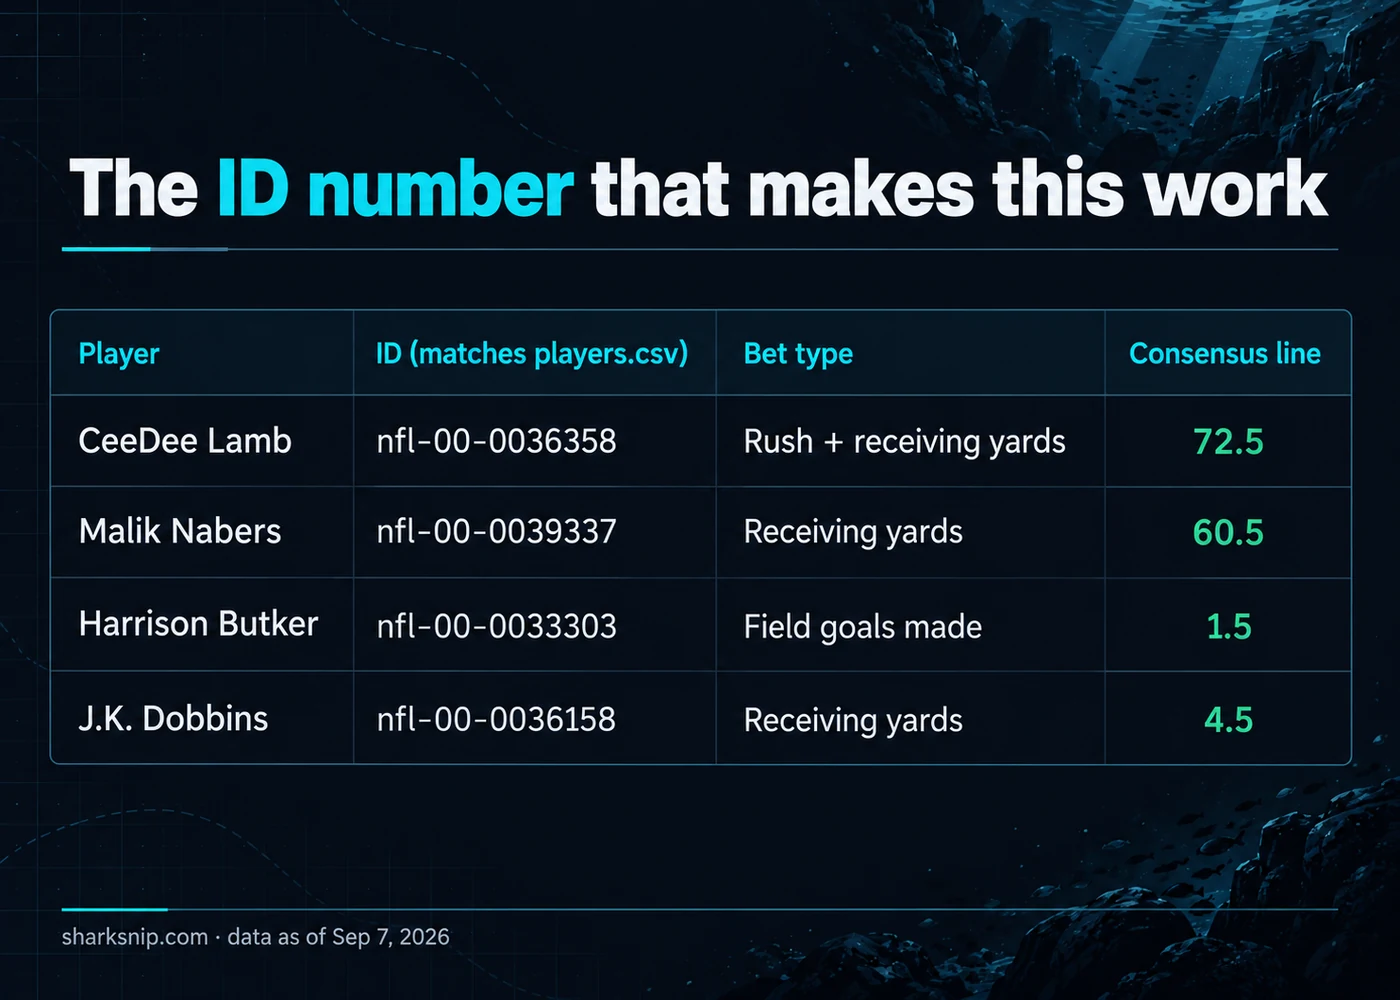
Our own player prop board stores that exact same ID, with our own prefix added. J.K. Dobbins is recorded as nfl-00-0036158. Strip the prefix and you get the same ID players.csv is keyed on. That's the whole match. A roster file supplies the name, position and team. Our board supplies the line. That shared ID is what lines them up.
In R, the language nflverse builds this file for, one function call pulls this exact table and nothing else. No market data attached, by design. Any process that needs both a name and a line has to run two reads and one match, not one read. The roster call for identity. Our own board for the number. And that shared ID to line the two up correctly.
What the match actually returns today
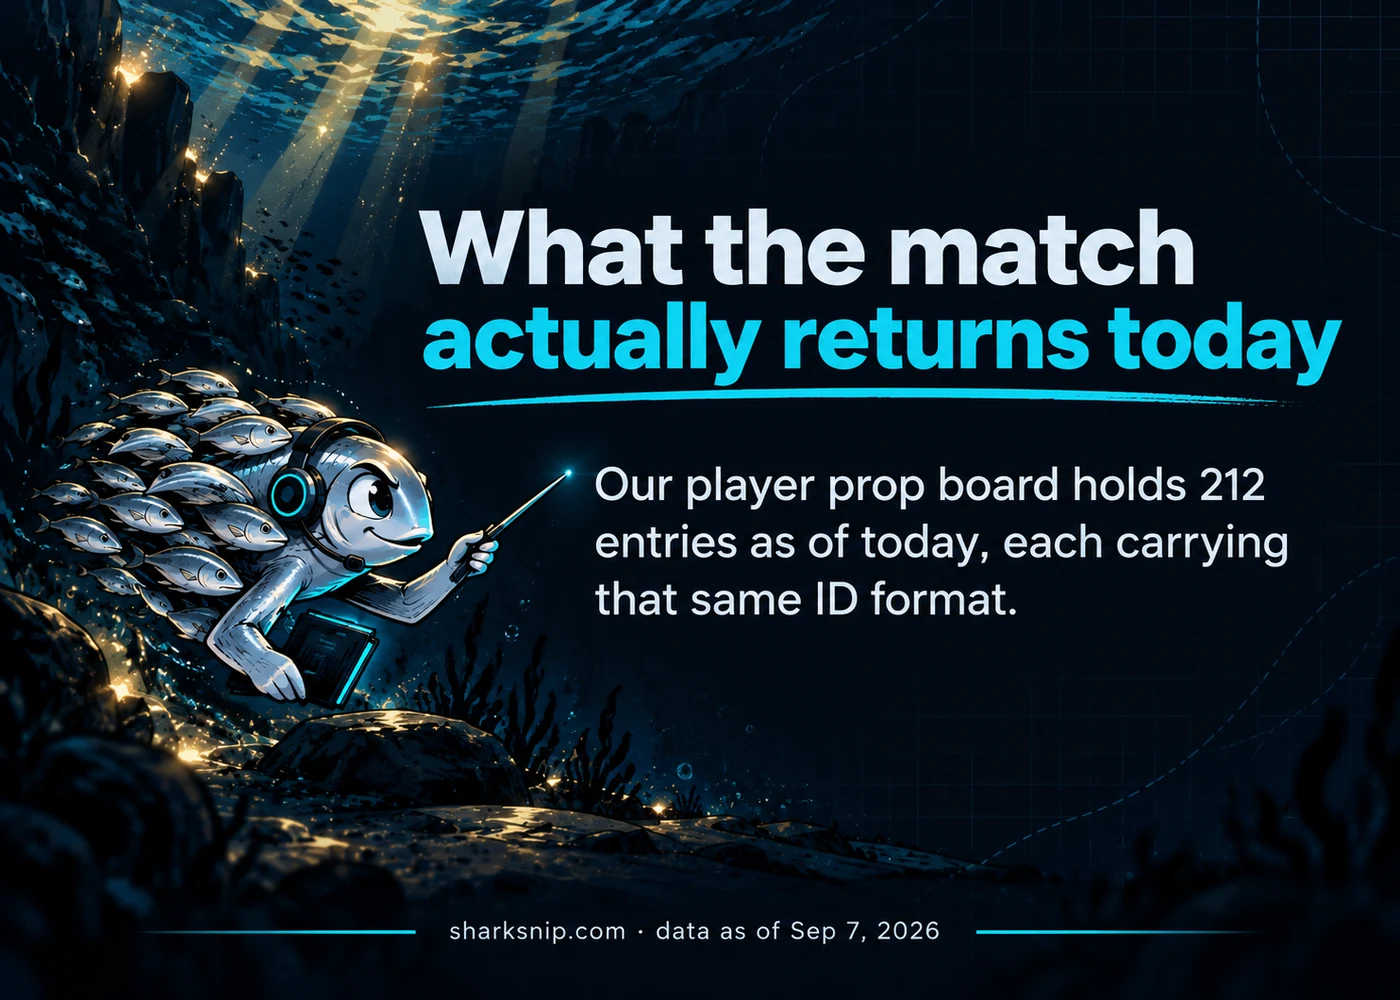
Our player prop board holds 212 entries as of today, each carrying that same ID format. Four sample entries show the shape. A name and an ID that would match against players.csv, the type of bet, and the line itself.
| Player | ID (matches players.csv) | Bet type | Consensus line |
|---|---|---|---|
| CeeDee Lamb | nfl-00-0036358 | Rush + receiving yards | 72.5 |
| Malik Nabers | nfl-00-0039337 | Receiving yards | 60.5 |
| Harrison Butker | nfl-00-0033303 | Field goals made | 1.5 |
| J.K. Dobbins | nfl-00-0036158 | Receiving yards | 4.5 |
Every one of those four lines is the same story. players.csv would supply the name, position and team. Our board supplies the number. Neither file does both jobs, and that's the entire point of keeping a roster lookup and a market board separate.
Our 212 entries split across 17 different bet types, and the split is uneven. Receiving yards, receptions, and longest reception each carry 28 entries, the three biggest groups on the board. The other fourteen bet types split the rest thinner, all the way down to 212 entries across 17 bet types in total. Every one of those bet types needs the same ID match to attach a name to the number. The match doesn't change by bet type. Only the line does.
Where the pipeline runs dry
We call it a consensus line, but across all 212 entries, zero carry both a PrizePicks number and an Underdog number at once. Every single entry has exactly one book present and the other empty. The gap between them reads zero on all 212, for the same reason. There's nothing to compare it against yet. Consensus, here, means one book's number carried forward. Not an actual cross-book agreement. That's a fact about what we've got right now, not about the match method. The ID match works the same either way. But it's worth knowing that today it's attaching a single-book line, not a blended one.
We also hold an older PrizePicks scrape with 172 entries, but it's from June 3, more than three months stale next to today's board. It carries recognizable names. Cooper Kupp on Seattle, at a 34.5 receiving-yards line. It shouldn't be treated as today's market. Use the fresher board for anything dated as current.
The college gap this pipeline avoids
We don't have a college version of this player prop board. Our only college data is game-level, spread and total per matchup, with no player entries and no player IDs at all. So this exact players.csv match has no college version to reach for here. A college player prop line simply isn't something we track. Nothing above should be read as covering one.
The live version of the table above sits on the player props page, with the game-level board it ties back to on the NFL odds desk and the odds page. A companion piece looks at players.csv itself as a flat lookup table, rather than the match in front of it: players.csv in nflverse-data is a flat lookup table. The general shape of how our data connects is covered in the sports-data walkthrough.

The Receipts Drawer
The mechanism here is simple once you see it. One public file holds who a player is. Our own board holds what he's priced at. A shared ID number is the only thing connecting them, and it works the same for all 212 lines we track today. What doesn't work yet: calling any of these lines a real consensus, since all 212 come from a single book each. Watch for a second book to show up on these same IDs. That's the day "consensus" here actually means something.