Nothing turns a green ticket into a bad-beat screenshot faster than an empty-net goal. You sit on Under 6 with 90 seconds left, score is 4-2, and the trailing team's goalie heads to the bench. Two empty-net goals later, the total is 6 and you are pushing — or 7 and you are losing. Empty-net goals are not random. They follow patterns, they cluster at predictable score margins, and the market underprices their effect on totals more often than it should. This guide walks through the math, the late-game scenarios that produce them, and how to think about totals when the empty net is the deciding event.
How often empty-net goals actually score
League-wide, roughly 3.5 to 4 percent of all NHL goals are scored on an empty net. That sounds small, but the conditional rate is what matters. Given that a team pulls the goalie in the last two minutes trailing by one or two:
- Trailing by 1, ~90 seconds left: empty-net goal scores roughly 22 to 28 percent of the time
- Trailing by 2, ~2 minutes left: empty-net goal scores roughly 30 to 35 percent
- Trailing by 3, ~3 minutes left: empty-net goal scores roughly 35 to 40 percent (often 2+ ENGs)
So in maybe one out of every three or four games, a late-game pulled-goalie spot meaningfully affects the total. That is not a footnote — that is a core feature of NHL totals modeling.
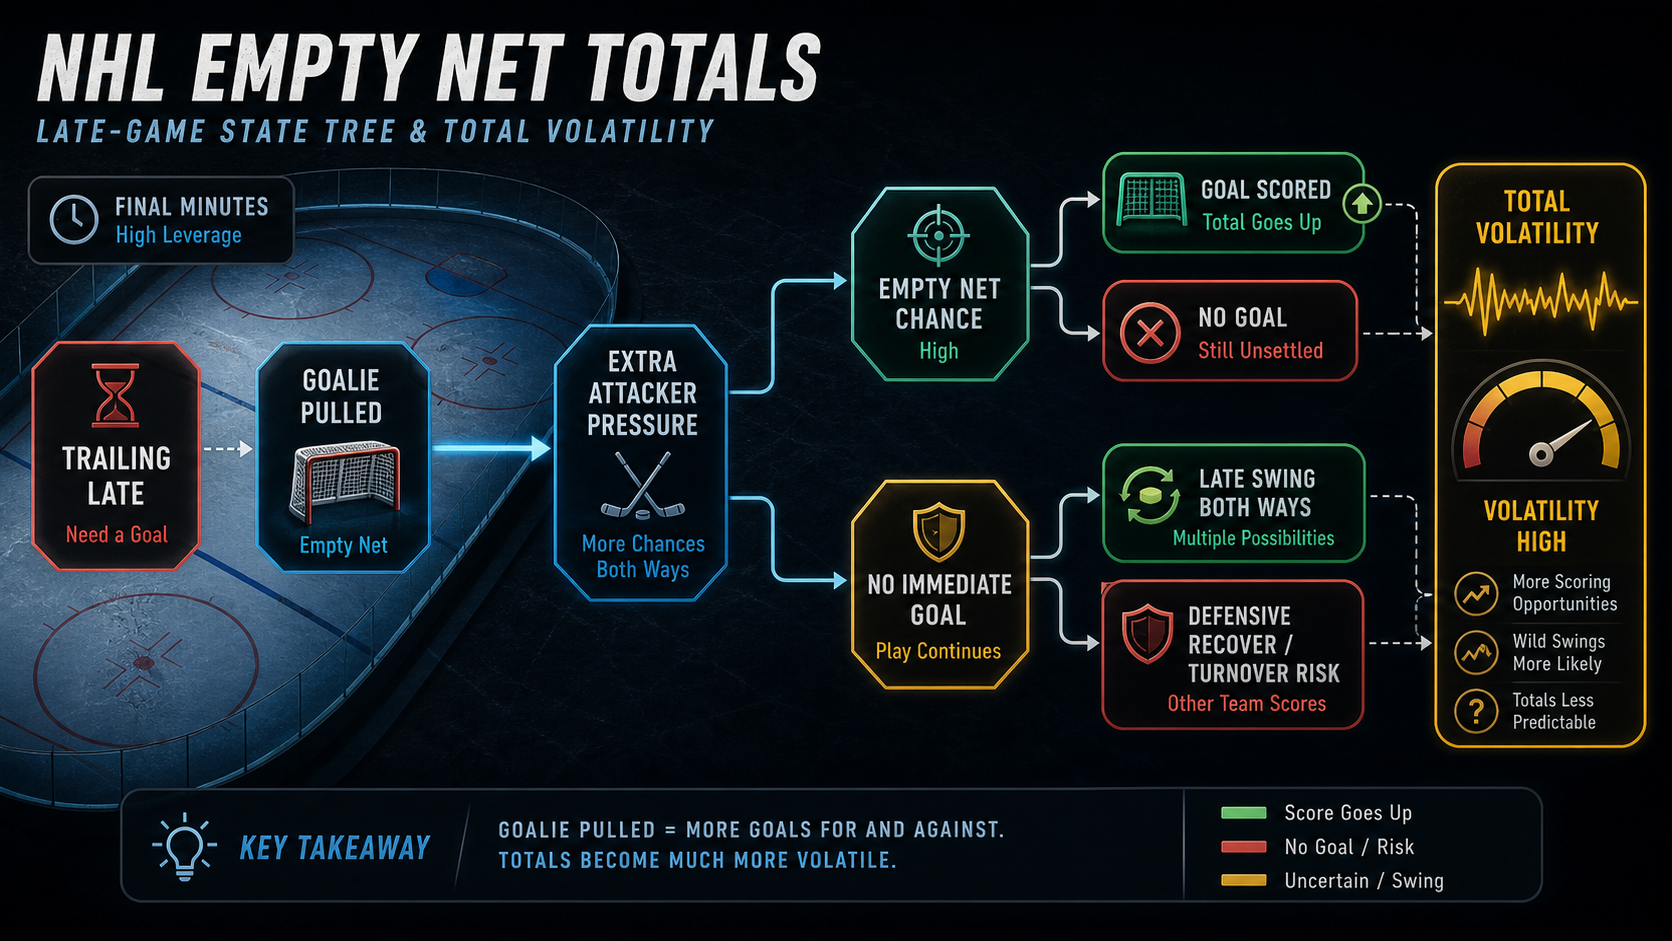
The late-game scenario tree
Late-game NHL has a specific decision tree:
- Trailing team takes a timeout with 1:30 to 2:30 left.
- Goalie pulled on a faceoff in the offensive zone, often immediately after.
- 6-on-5 attack for the rest of regulation, sometimes longer in 2-goal deficits.
- Three outcomes: trailing team scores (20-25%), defending team gets clearance and ENG (25-35%), nothing happens (40-50%).
That third outcome is what totals bettors care about. When a goalie pull happens, the rate of any goal scoring rises sharply. Most casual models assume late-game scoring slows. Empty-net models reverse that assumption.
A worked example
Game total: 6. Score with 2 minutes left: 3-2. Combined goals so far: 5. A casual under bettor on 6 thinks they're cruising. The actual probability tree:
- ~20% chance the trailing team ties (tying goal pushes total to 6 — push, not loss, but kills the win)
- ~28% chance the leading team scores an ENG (total to 6 — push)
- ~5% chance both happen (total to 7 — loss)
- ~47% chance neither happens (total stays at 5 — under wins)
So the under at 6 is a 47 percent winner at the start of those final 2 minutes — far worse than it looks. The "cruising under" feeling that casual bettors have at 5 goals with 2 minutes left is wrong. The real win probability is roughly a coin flip.
Markets the empty net affects
- Game total over/under. The biggest single market the ENG hits. Unders take it on the chin in close games.
- Both teams to score (BTTS). Late-game ENG often flips a 4-0 game into a 4-1 final, but doesn't cover the trailing team. Less affected than totals.
- Team total over. The leading team's team total often pushes over via ENG. A leader sitting at 3.5 with 3:30 left and an ENG situation has surprisingly strong over-the-team-total prob.
- 3rd-period totals. 3rd-period totals are heavily influenced by ENG dynamics. Over bettors should price this in.
- Live unders. Live under prices late in close games systematically under-price the empty-net risk. Books usually correct, but in low-volume games they lag.
How the market prices empty nets
Sharp books bake empty-net rates into their pregame totals. They know the average margin distribution and the average ENG rate per game. But the live market is where mispricing tends to live, especially in lower-volume markets:
- Live unders late in 1- and 2-goal games are often slightly mispriced because the book's algorithm uses an aggregate ENG rate rather than the specific game state.
- Specific team-total overs for the leading team can be soft when the leader is at the team-total threshold and the game flow obviously favors a goalie pull.
Strategy: when to fade the late-game total
Three setups stand out for under bettors:
- Score is close, total is well clear. 4-3 game, total at 7, 4 minutes left. ENG risk is real but the cushion is large. Under is solid even with the ENG factored.
- Lead is 3+, late. 4-1 with 3 minutes — the trailing team often pulls, often gets scored on. If you're sitting on under 5.5 you're essentially betting against the ENG.
- Trailer has been hemmed in all night. If the leading team's xG and shots dwarf the trailer's, the ENG is even more likely than the league prior.
You can monitor live NHL totals and how often the late-game empty-net flips an under on the NHL picks dashboard.
Strategy: when to play the over
The cleaner empty-net play is on the over. Specifically:
- Live overs near the close mark. If the live total is at 5.5 and the score is 3-2 with 2 minutes, the implied probability of staying under often misprices the ENG rate.
- Leading team's team-total over. A team at 3 in a one-goal lead has a 25% shot at hitting 4 via ENG alone. Compare to the live odds.
- 3rd-period total overs. If the 3rd period sits at 1.5 and the score makes a goalie pull likely, the over has structural support beyond run-of-play scoring.
Modeling implications
The simplest model addition: a margin-conditional ENG rate. For each minute of the game, if the projected score margin is at -3 to -1, multiply expected goals by an empty-net adjustment. The base rate is small in average games but compounds in close-and-late spots. Models built in the Workshop can include this as a late-game scoring feature; without it, your live NHL totals will systematically miss empty-net spikes. The full pipeline lives at Build → New model if you want to wire the empty-net layer directly into an NHL totals artifact you can ship to the public leaderboard.
For deeper context on game-state edges, see our live betting strategy guide. The complementary NHL piece on side-market mechanics is NHL puck lines explained — empty-net dynamics interact with puck-line covers in close games even more than with totals.
Team-by-team pull tendency
Not every coach pulls the goalie at the same time. The earliest-pull staffs produce more empty-net goals against in close games; the latest-pull staffs leave fewer. A rough taxonomy from public play-by-play data:
- Aggressive (pull at 3:00+ when down 2, 1:45+ when down 1): Carolina, Toronto, Edmonton, Tampa. These teams generate more 6-on-5 time and more empty-net goals on both sides of the ledger.
- League average (pull at 2:30 when down 2, 1:30 when down 1): most teams. The market priors are calibrated to this group.
- Conservative (wait until 2:00 when down 2, 1:15 when down 1): a small group of older-school staffs. Lower ENG rate against; over bettors should discount.
Tag each team in your model with a pull-aggression score and recompute the late-game ENG adjustment per game. The lift is small but real, especially on team-total markets.
Tracking the edge across a season
A clean way to verify the lag is to track, every night, the live full-game total at the 2-minute mark in every game with a one- or two-goal margin. Record the live total, the realised final, and whether an ENG was attempted. Over 200+ samples a season, the gap between the live-implied probability of an under win and the realised under-win rate is the size of the structural edge. If your sample shows realised < implied, the live unders are over-juiced and you should fade. If realised > implied, live unders are an under-priced asset.
Public user-built NHL totals models on the model leaderboards sometimes encode this lag directly. The ones with the best closing-line value on third-period totals tend to be the ones with an explicit empty-net layer.
Practical bet construction
Three concrete play types capture the edge without exposing you to ugly variance:
- Live leading-team team-total over at the moment of goalie pull. Books usually take 30 to 90 seconds to widen this line. Hit the over within that window and you are essentially betting against the trailing team scoring on the 6-on-5.
- Pre-game third-period over in games with a market-implied close finish. If the pregame total is 6 and the spread is pick-em, the third period total at 1.5 prices in some empty-net risk but rarely the full amount. Take the over.
- Player props on the leading team''s top forwards. Forwards on the leading team in close games take more empty-net shots — their shots-on-goal over and goals-scored prop have structural support from the late-game state. The shots-prop edge survives at retail books for hours.
The DFS overlay
Empty-net goals are essentially free production for the leading team''s point-getters. DFS contests on the Gridiron hub show how the field is positioned on goalies vs skaters, and you can stack the leading-team forwards against teams that pull aggressively as a structural late-game leverage play. The same ENG pattern that decides totals also decides whether your DFS lineup hits its 90th-percentile outcome.
What user-built model snippets ship for this
Search the model marketplace for "ENG-adjusted NHL totals" templates. Several public models encode the margin-conditional adjustment as a swappable Block; the closing-line-value table shows which ones held up in close-and-late spots last season. Forking one of those is the fastest path to a usable empty-net layer if you don''t want to build the math from scratch.
Bottom line
Empty-net goals are not a fluke. They are a structural feature of NHL totals — about a quarter of close late games produce an ENG, and a meaningful fraction of unders that "should win" lose to one. The biggest edges are on live overs in 1-goal games and team totals for leading teams sitting at threshold. The biggest pain is from sitting on a thin under cushion late and hoping the goalie stays in net. Price the empty net into every late-game NHL bet you make, and you will stop being surprised by the same outcome that quietly decides hundreds of tickets a season.
Bet responsibly — set limits, never chase losses.
NHL example board
NHL betting gets sharper once the goalie and shot-profile examples are named. Igor Shesterkin and Connor Hellebuyck are useful starter-confirmation examples because the move can touch moneylines, puck lines, team totals, and saves props at different speeds. Connor McDavid and Nathan MacKinnon are shot-volume examples where one elite skater can change power-play expectations and empty-net math even when the full-game total barely moves.
- Goalie confirmation: compare the starter upgrade to the moneyline and total move, not just the headline name.
- Puck line: decide whether the favorite can create margin without needing an empty-net goal.
- Totals: watch whether the Oilers, Panthers, or Jets profile points to pace, power-play pressure, or a low-event game.
- Saves props: do not bet volume without checking shot quality and whether the underdog can keep the game competitive.
NHL update rules
The best NHL pages need a late-news checklist because morning-skate information is often incomplete. Revisit goalie confirmations, line rushes, power-play units, travel fatigue, and empty-net incentives before locking in. The companion workflows are goalie confirmation edges and same-game parlay correlation.
Sport-specific model signals
Use names as evidence, not decoration. The useful SEO win is that Josh Allen, Ja'Marr Chase, Bijan Robinson and Puka Nacua and Chiefs, Bills, Eagles and Lions appear inside decisions, thresholds, and internal links instead of being dumped into a keyword list.
- Prop EV example: Luka Doncic points or PRA at 32.5 should be checked against projected minutes, usage without key teammates, pace, spread, and back-to-back fatigue before price.
- MLB: a Dodgers at Rockies first-five total of 5.5 should account for starter xFIP, K-BB%, handedness, Coors Field run environment, wind, bullpen rest, and umpire zone.
- NHL: a Maple Leafs puck-line price at +160 needs confirmed goalie, 5v5 expected-goal share, special-teams edge, and empty-net probability before the margin bet makes sense.
- UFC: an Islam Makhachev-style grappling favorite needs takedown entries, control time, get-up rate, and submission exposure; an Alex Pereira-style striker needs knockdown equity and round-by-round cardio risk.
- DFS value example: NBA showdown builds need projected minutes, usage, salary, ownership, and late-swap flexibility before a star salary is worth paying.
- Stack example: an NBA same-game entry with Doncic points, teammate assists, and opponent threes needs one coherent pace script instead of three unrelated legs.
The goal is not to mention every star. It is to show how the model changes when the example changes from Doncic to Shohei Ohtani, Igor Shesterkin, Connor McDavid, or Tom Aspinall. Revisit and update the board when lineups, minutes, starters, goalie confirmations, weigh-ins, or market prices change.
Research note board
Use this table to turn the guide into a decision note. The point is to know when the idea is actionable and when it is only context.
| Angle | Input to verify | Example application | Pass when |
|---|---|---|---|
| Market price | Spread, total, moneyline, prop price, or futures hold | Chiefs and Bills compared through hold | The price has moved past the number that created the edge |
| Football or sport context | Role, pace, weather, injury status, opponent style | Josh Allen role news mapped to the relevant market | The original input changes or remains unconfirmed |
| Review loop | Entry, close, result, and reason code | totals logged with a clear thesis | You cannot explain whether the process beat the market |
Average total points by weather bucket
Average combined points scored in NFL games by weather bucket over recent seasons. Wind above 20mph and snow each clip totals by 6-8 points vs domed games, which is why books move totals aggressively when forecasts shift.
NFL ATS cover-margin distribution
Distribution of (final margin − closing spread) across an NFL season. Roughly normal with mean ≈ 0 and standard deviation ≈ 13 points, which is why most ATS edges live in the ±1.5 point window.