Two teams play in Denver, sea level somewhere else, and the same lineups produce a 12-run game in one and a 6-run game in the other. That gap is mostly park factor, the single most predictable input in MLB totals modeling. This piece walks through what park factors actually measure, why Coors Field and Camden Yards are extreme, and how to apply the park factor adjustment to a totals projection without double-counting.
What park factors measure
A park factor is a multiplicative adjustment that compares run-scoring at a given park to the league average, controlling for the teams that play there. A park factor of 1.05 means the park produces 5% more runs than league average; 0.95 means 5% fewer.
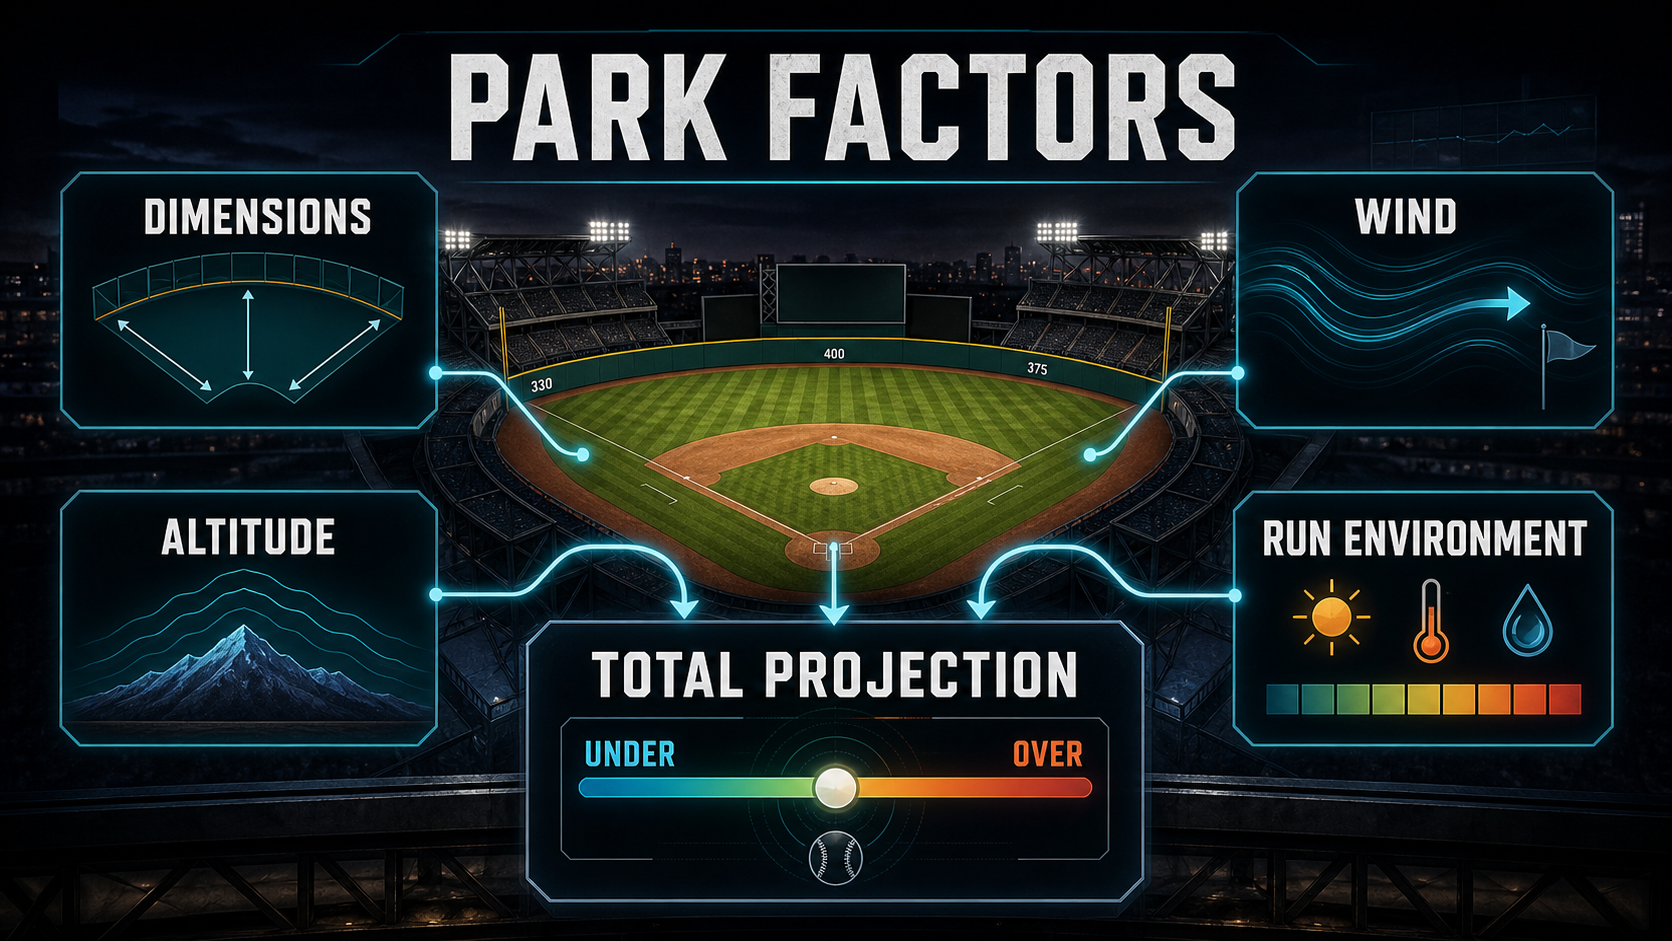
The total park factor is built from sub-factors:
- Run factor — overall scoring multiplier.
- Home run factor — how often fly balls clear the wall.
- Doubles factor — gap power and outfield dimensions.
- Single factor — base hit rate, driven by infield play and turf.
For totals betting, the run factor is the headline number, but the home run factor often drives more of the variance because home runs are the lumpiest scoring event.
Coors Field: the extreme
Coors Field plays at altitude (about 5,200 feet), where the ball travels roughly 5-7% farther in the air. The park's run factor sits around 1.20-1.25 — by far the most extreme in MLB. That is not a small adjustment; it is a half-run swing on the total.
The downstream effects:
- Pitcher ERAs at Coors are misleading. A 4.20 ERA Rockies starter is roughly equivalent to a 3.50 ERA at a neutral park.
- Hitter stats are inflated. A .280 hitter at Coors might be a .265 hitter on the road.
- Bullpen demand is higher. Coors games run longer with more pitching changes, which fatigues the bullpen and creates carryover effects on the next series.
The market knows all this and prices Coors totals around 11 even with average pitchers. Where the public still goes wrong is on the variance — Coors games have wider distributions than other games, which makes the over hit a touch more often than the implied 50%.
Camden Yards and the home run park
Camden Yards underwent a left-field wall change a few years ago that significantly cut its home run factor for right-handed hitters. Before the change, the park factor for HRs was 1.15+. After the change, it is closer to 0.95 to right-handed power and unchanged for lefties.
That kind of mid-season or year-over-year park change is the most under-priced input in totals betting. The market can take 30-50 games to fully adjust to a new wall configuration. If you are watching for those shifts, our model builder exposes a park-factor feature that updates with rolling-window data.
A worked example
Suppose the Dodgers visit the Rockies in mid-July. Both teams have league-average run-scoring profiles. The Dodgers send a top-15 starter; the Rockies send a back-end arm. The book hangs the total at 11.
The honest math: at a neutral park, the matchup projects about 8.5 runs (Dodgers' starter limits the Rockies' offense, Rockies' starter struggles against the Dodgers' lineup). Apply the Coors run factor of 1.22, and the projection goes to about 10.4. The book at 11 is reasonable but slightly over.
Where this gets interesting is in the home run total props. With the HR park factor at Coors at 1.30+, individual hitter HR props skew over more than at any other park. A power hitter with a 2.5 HR yes/no prop priced -150 at home and +180 at Coors is a meaningful difference, and the implied probabilities at Coors should be 5-10 percentage points higher.
Pitcher's parks and the under angle
The opposite end of the spectrum is the pitcher-friendly parks: Petco Park in San Diego, Tropicana Field in Tampa, Comerica Park in Detroit. These run park factors of 0.90-0.95.
- Petco — heavy marine layer, deep gaps, ball does not carry. Run factor around 0.92.
- Tropicana — dome, no wind, but the dimensions and turf produce fewer extra-base hits than they used to.
- Comerica — large outfield, big home run park factor for lefties at the porch but suppresses right-handed power.
Totals at these parks should run 0.5-0.8 below a neutral matchup. The market mostly prices this in, but the under at these parks does outperform on average — especially when the matchup pairs two top-15 starters.
Park factors for hitter props
Park factors are not just for totals. Individual hitter props move with the park as well. A home run prop is the most sensitive — Coors lifts the implied probability by 30%; Petco drops it by 8%. Total bases props scale similarly. Hits props are more weakly correlated because singles are less park-sensitive than extra-base hits.
For nightly hitter prop projections that account for park, see our player props page and the MLB picks board for the matchup-level reads.
Common mistakes in park factor betting
- Using stale park factors. Walls change, weather patterns shift, dimensions move. Use a 2-3 year rolling park factor, not a 10-year one.
- Double-counting park in pitcher stats. If you are using FIP-based projections, FIP already park-adjusts at most sources. Layering a second park factor over an already-adjusted projection inflates the impact.
- Ignoring weather at outdoor parks. Wind is the largest single-game park-factor modifier. A 15+ mph out-to-center wind at Wrigley shifts that game's run factor by 15-20%.
- Treating dome parks as neutral. Dome parks have different distributions than open-air parks, and their park factors are not always 1.00.
How to use park factors in your workflow
The cleanest workflow is to project the totals from a neutral-park base — starting pitcher, lineup, bullpen — then apply the park run factor as a final multiplier. If the wind is strong (15+ mph), apply a wind adjustment as a second layer. This keeps the inputs independent and prevents the double-counting trap.
For systematic park-adjusted projections, see the MLB leaderboards for park-aware models, the first-five innings edge guide for related totals content, and the live gridiron grid for tonight's park-and-weather adjusted edges.
Wind: the hidden park-factor multiplier
Park factor is the baseline; wind is the multiplier that nobody prices correctly on the day. A 15 mph out-to-center wind at Wrigley shifts the effective run factor of that game by 15-20% above the park's static factor. The same wind blowing in suppresses it by similar magnitude. Stadiums with persistent wind patterns (Wrigley, Yankee Stadium, Citi Field) see daily swings in effective park factor that the closing total often misses by a quarter to half a run.
The check is mechanical: pull the first-pitch wind direction and speed, classify as out (lifts total), in (suppresses), or cross (mild effect on HR but not total), and apply a 0.05-0.15 run multiplier to the park-adjusted projection. Strong out-winds (15+ mph) at hitter parks should push your over conviction up by half a unit; strong in-winds at pitcher parks should push your under conviction similarly. Domed parks (Tropicana, Globe Life roof closed, Rogers Centre roof closed) skip this layer entirely.
Building park-aware models
The cleanest park-aware total model has a four-stage flow: (1) neutral-park starter and bullpen projection from FIP, (2) lineup quality adjustment by opposing handedness OPS split, (3) park run-factor multiplier (rolling 2-year), (4) wind/temperature adjustment if outdoor. Fork the park-feature template in the workshop — it ships with rolling 2-year park factors, daily wind feeds, and temperature splits, so you can train on a clean neutral-park base and let the park layer do its job. Publish your tuned version to the marketplace if your park-adjusted CRPS beats the field on totals.
Bottom line
Park factors are the most predictable input in MLB totals modeling. Coors lifts totals by 20-25%, Camden Yards is HR-friendly to lefties only since the wall change, and pitcher's parks like Petco shave half a run off a neutral projection. Apply the park factor as a final multiplier on a neutral projection, watch for mid-season park changes that the market is slow to adjust to, and use the same factor logic for hitter props — especially home run yes/no markets.
Bet responsibly — set limits, never chase losses.
MLB example board
A baseball betting read needs names because starter, lineup, park, and umpire inputs can move the number before the public sees the reason. Shohei Ohtani, Aaron Judge, and Juan Soto are clean examples for lineup gravity because one premium bat can alter run expectancy, opposing bullpen choices, and same-game prop pricing. Tarik Skubal and Spencer Strider are starter examples where strikeout ceiling, pitch count, and opponent handedness can matter more than the season-long team record.
- First five innings: isolate the starter matchup before bullpen quality muddies the handicap.
- Starter scratch: separate true downgrade from book cleanup after the market overreacts.
- Park factor: Coors Field, Camden Yards, and Petco Park should not be treated like the same run environment.
- Lineup news: Ohtani, Judge, or Soto availability can move both full-game totals and hitter props.
MLB update rules
The article should be updated when a confirmed lineup, starter change, roof status, umpire assignment, or weather shift changes the edge. For related workflows, use MLB first-five betting and closing-line value to decide whether the move created value or simply erased it.
Sport-specific model signals
Use names as evidence, not decoration. The useful SEO win is that Josh Allen, Ja'Marr Chase, Bijan Robinson and Puka Nacua and Chiefs, Bills, Eagles and Lions appear inside decisions, thresholds, and internal links instead of being dumped into a keyword list.
- Prop EV example: Luka Doncic points or PRA at 32.5 should be checked against projected minutes, usage without key teammates, pace, spread, and back-to-back fatigue before price.
- MLB: a Dodgers at Rockies first-five total of 5.5 should account for starter xFIP, K-BB%, handedness, Coors Field run environment, wind, bullpen rest, and umpire zone.
- NHL: a Maple Leafs puck-line price at +160 needs confirmed goalie, 5v5 expected-goal share, special-teams edge, and empty-net probability before the margin bet makes sense.
- UFC: an Islam Makhachev-style grappling favorite needs takedown entries, control time, get-up rate, and submission exposure; an Alex Pereira-style striker needs knockdown equity and round-by-round cardio risk.
- DFS value example: NBA showdown builds need projected minutes, usage, salary, ownership, and late-swap flexibility before a star salary is worth paying.
- Stack example: an NBA same-game entry with Doncic points, teammate assists, and opponent threes needs one coherent pace script instead of three unrelated legs.
The goal is not to mention every star. It is to show how the model changes when the example changes from Doncic to Shohei Ohtani, Igor Shesterkin, Connor McDavid, or Tom Aspinall. Revisit and update the board when lineups, minutes, starters, goalie confirmations, weigh-ins, or market prices change.
Research note board
Use this table to turn the guide into a decision note. The point is to know when the idea is actionable and when it is only context.
| Angle | Input to verify | Example application | Pass when |
|---|---|---|---|
| Market price | Spread, total, moneyline, prop price, or futures hold | Chiefs and Bills compared through PPR | The price has moved past the number that created the edge |
| Football or sport context | Role, pace, weather, injury status, opponent style | Josh Allen role news mapped to the relevant market | The original input changes or remains unconfirmed |
| Review loop | Entry, close, result, and reason code | totals logged with a clear thesis | You cannot explain whether the process beat the market |
Average total points by weather bucket
Average combined points scored in NFL games by weather bucket over recent seasons. Wind above 20mph and snow each clip totals by 6-8 points vs domed games, which is why books move totals aggressively when forecasts shift.
NFL ATS cover-margin distribution
Distribution of (final margin − closing spread) across an NFL season. Roughly normal with mean ≈ 0 and standard deviation ≈ 13 points, which is why most ATS edges live in the ±1.5 point window.