
Should we trust a two-week MLB hitter hot streak, or should the model pull the projection back toward the long-run baseline? That is the practical question behind this method family. Recent form matters in sports, but recent form is also where bettors overreact. Rolling windows, exponential averages, and shrinkage help a model respect new information without pretending every short streak is a new true talent level.
The plain-English version
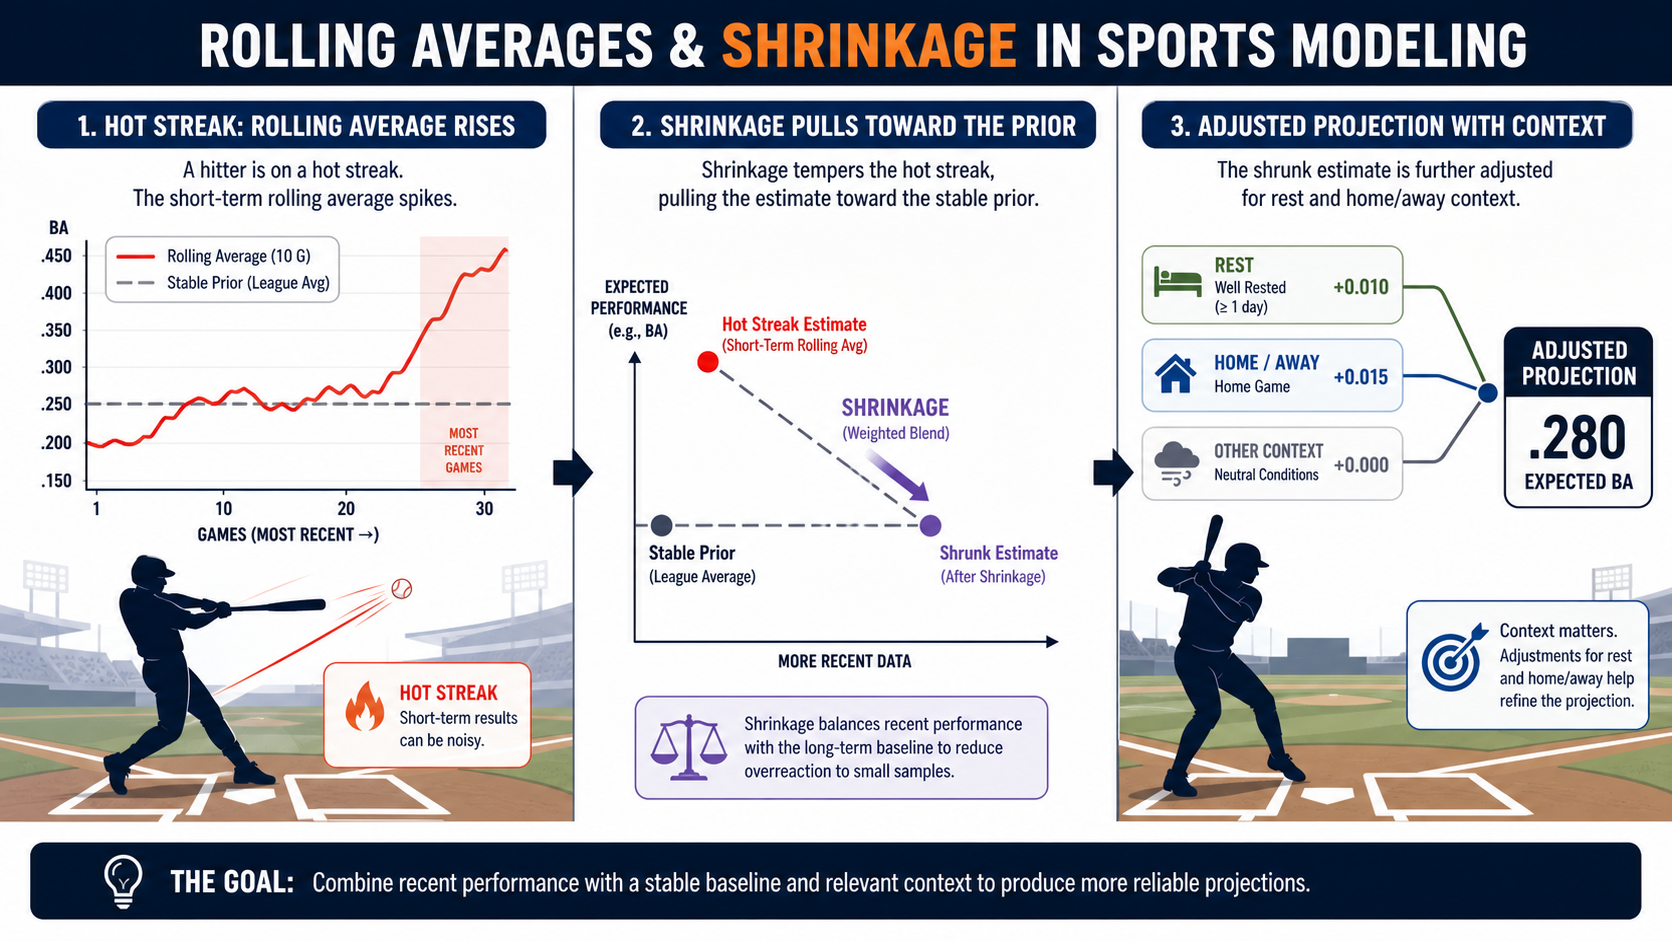
Recent form matters in sports, but recent form is also where bettors overreact. Rolling windows, exponential averages, and shrinkage help a model respect new information without pretending every short streak is a new true talent level.
The novice trap is to treat the method name as magic. The useful move is to ask what information the method can learn, what it cannot learn, and what kind of sports question it is actually built to answer. A method that is excellent for ranking team strength can be poor for a single player prop, and a method that wins a backtest can still be unbettable if the edge appears only after the market has moved.
Start with the target. A spread model, moneyline model, player prop projection, DFS lineup optimizer, and fantasy ranking all answer different questions. Then check the timestamp of every feature. If the feature would not have been known before the bet, contest lock, or lineup decision, it does not belong in the model. Finally, compare the output to the right benchmark: the closing line, the posted prop, the field ownership, or the best available projection.
Method-by-method guide
rolling-avg-window
A rolling average summarizes the most recent fixed number of games or events, giving the model a simple view of current form. In sports terms, this is the part of the model that decides how to translate noisy pre-game inputs into a usable betting, fantasy, or DFS signal instead of a loose opinion.
Where it helps: For an MLB hitter, it can show whether recent hard-hit rate or strikeout rate is moving before the market fully adjusts. The practical test is whether the block improves decisions on games it has not seen, not whether it explains last night's box score after the answer is known.
Where it fails: It can chase hot streak noise when the window is too short or when recent opponents were unusually weak. The fix is usually cleaner targets, stricter time cuts, a smaller feature set, or a calibration layer before the output reaches a staking or lineup workflow.
exponential-moving-average
An exponential moving average weights recent observations more heavily while still keeping older observations in the estimate. In sports terms, this is the part of the model that decides how to translate noisy pre-game inputs into a usable betting, fantasy, or DFS signal instead of a loose opinion.
Where it helps: It helps when a hitter changes role, lineup spot, or swing quality gradually rather than all at once. The practical test is whether the block improves decisions on games it has not seen, not whether it explains last night's box score after the answer is known.
Where it fails: It can still lag a sudden injury or mechanical change and can overreact if the decay rate is too aggressive. The fix is usually cleaner targets, stricter time cuts, a smaller feature set, or a calibration layer before the output reaches a staking or lineup workflow.
shrinkage-to-mean
Shrinkage pulls an extreme estimate toward a larger prior so small samples do not receive full trust. In sports terms, this is the part of the model that decides how to translate noisy pre-game inputs into a usable betting, fantasy, or DFS signal instead of a loose opinion.
Where it helps: It keeps an MLB hot streak anchored to a stable baseline until the hitter produces enough plate appearances to prove a new level. The practical test is whether the block improves decisions on games it has not seen, not whether it explains last night's box score after the answer is known.
Where it fails: It can be too conservative when a real skill change occurs, such as a player returning with a new swing path or role. The fix is usually cleaner targets, stricter time cuts, a smaller feature set, or a calibration layer before the output reaches a staking or lineup workflow.
rest-days
Rest-days measures how much time a player or team had between games, which can affect lineup strength, fatigue, and usage. In sports terms, this is the part of the model that decides how to translate noisy pre-game inputs into a usable betting, fantasy, or DFS signal instead of a loose opinion.
Where it helps: It helps separate a hitter sitting after a travel stretch from a hitter projected for full volume after a normal rest pattern. The practical test is whether the block improves decisions on games it has not seen, not whether it explains last night's box score after the answer is known.
Where it fails: It can become a weak proxy if the model does not also know lineup confirmation, opponent pitcher quality, or travel context. The fix is usually cleaner targets, stricter time cuts, a smaller feature set, or a calibration layer before the output reaches a staking or lineup workflow.
home-away-split
Home-away split tracks performance differences by venue context, including park dimensions, travel, and comfort factors. In sports terms, this is the part of the model that decides how to translate noisy pre-game inputs into a usable betting, fantasy, or DFS signal instead of a loose opinion.
Where it helps: It is useful when an MLB hitter has a stable park-driven baseline that changes the projection compared with neutral context. The practical test is whether the block improves decisions on games it has not seen, not whether it explains last night's box score after the answer is known.
Where it fails: It can badly overfit if the split is small, park factors changed, or the apparent home edge is really opponent quality. The fix is usually cleaner targets, stricter time cuts, a smaller feature set, or a calibration layer before the output reaches a staking or lineup workflow.
Sports walkthrough
For an MLB hitter, start with season baseline production, add rolling contact quality, weight the most recent plate appearances with exponential-moving-average, then apply shrinkage-to-mean so the hot streak does not erase years of evidence. Rest-days and home-away-split features add context without letting one ballpark series rewrite the player profile.
Concrete names keep the model honest: Shohei Ohtani can create real form changes through contact quality, Aaron Judge can produce noisy short bursts through power variance, and Juan Soto can keep a stable baseline even when week-to-week hits fluctuate. Those examples are not there to imply a pick; they force the workflow to deal with real role changes, injury context, usage shifts, opponent quality, and market reaction instead of abstract rows in a table.
The workflow is deliberately boring. Define the event, gather only pre-decision information, produce a projection or probability, compare it with the market or contest environment, size the action conservatively, and then record what happened. When the number closes, the closing price becomes the first audit. When the game finishes, the outcome becomes the second audit. Over a useful sample, both audits matter more than whether one bet won.
Validation workflow
Validate this method family in the same shape it will be used live. Train on older games, tune on a later slice, and reserve the newest window for the final check. If the method uses player props, keep player identity, team context, injury status, and market number aligned to the timestamp when the decision would have been made. If it uses DFS simulations, lock the slate, salary, ownership, and injury assumptions before grading lineups.
Compare against a plain benchmark before celebrating lift. A model should beat a naive average, a market-only view, and a smaller interpretable version before the extra complexity deserves product space. The important comparison is not whether the method can explain the past; it is whether it improves decisions after fees, vig, contest rake, stale lines, and real lineup constraints are included.
Review failures as carefully as wins. A losing pick that beat the close can still be a useful process signal, while a winning pick that took a bad number can be a warning. Group errors by sport, market, player role, team, confidence bucket, and price range so the builder can tell the difference between normal variance and a broken assumption.
Expert notes
Window length is a modeling assumption. A five-game rolling average reacts quickly but is noisy. A 60-game window is stable but slow. Test several windows walk-forward instead of picking the one that best explains yesterday.
EMA is useful when newer information deserves more weight, but the decay rate must match the sport. MLB plate appearances accumulate differently than NBA minutes or NFL targets.
Shrinkage is especially important for sparse splits. A hitter can look extreme at home or on the road after 30 plate appearances, but that split needs to be pulled toward a larger prior until the sample earns more freedom.
Rest and travel can be real, but they are often proxies for lineup quality, pitcher quality, or scheduling. Validate them against a market-aware baseline before trusting them.
When not to use this family
Do not use a method just because it is more advanced than a baseline. If the data is thin, the target is unstable, the sport context changed, or the market already absorbs the signal, a simpler model with better validation is usually the better tool. The warning sign is a model that needs a long explanation for why its live results should be ignored.
Watch for leakage, repeated samples, and hidden correlation. A player prop model can accidentally learn same-game information through closing lines, a DFS optimizer can double count teammate correlations, and a ratings model can overstate certainty after one noisy result. If a method cannot survive a walk-forward split, a holdout season, and a calibration check, keep it in research.
Decision checklist
| Modeling question | Useful block | Risk check |
|---|---|---|
| What is the cleanest baseline for this sports decision? | rolling-avg-window | Confirm the target, feature timestamp, and market comparison are all aligned before training. |
| Which block adds lift without turning noise into confidence? | home-away-split | Compare walk-forward performance, calibration, and closing-line value before trusting the output. |
How Shark Snip uses it
Shark Snip uses rolling-avg-window, exponential-moving-average, shrinkage-to-mean, rest-days, and home-away-split as form and context blocks that can feed player prop, game, and fantasy models without overreacting to noise.
The block names above are intentionally visible in this article so model builders can connect the concept to the actual building blocks in Tinker, DFS simulation, and the model marketplace. Shark Snip treats these methods as components in a workflow: feature preparation, model fit, probability repair, portfolio construction, and post-game evaluation. No block is allowed to skip validation because every sport has small samples, changing incentives, and noisy injury information.
The most useful model is not the one with the most intimidating name. It is the one whose assumptions match the sport question, whose inputs were available at decision time, whose output is calibrated enough to compare with a price, and whose failures are visible before real bankroll or contest exposure is increased.
Related reading and tools
Keep going with building your first model with Tinker, closing-line value, bet tracking. These links connect the method family to the betting, DFS, and model-building workflows readers already use.
MLB example board
A baseball betting read needs names because starter, lineup, park, and umpire inputs can move the number before the public sees the reason. Shohei Ohtani, Aaron Judge, and Juan Soto are clean examples for lineup gravity because one premium bat can alter run expectancy, opposing bullpen choices, and same-game prop pricing. Tarik Skubal and Spencer Strider are starter examples where strikeout ceiling, pitch count, and opponent handedness can matter more than the season-long team record.
- First five innings: isolate the starter matchup before bullpen quality muddies the handicap.
- Starter scratch: separate true downgrade from book cleanup after the market overreacts.
- Park factor: Coors Field, Camden Yards, and Petco Park should not be treated like the same run environment.
- Lineup news: Ohtani, Judge, or Soto availability can move both full-game totals and hitter props.
MLB update rules
The article should be updated when a confirmed lineup, starter change, roof status, umpire assignment, or weather shift changes the edge. For related workflows, use MLB first-five betting and closing-line value to decide whether the move created value or simply erased it.
Sport-specific model signals
Use names as evidence, not decoration. The useful SEO win is that Josh Allen, Ja'Marr Chase, Bijan Robinson and Puka Nacua and Chiefs, Bills, Eagles and Lions appear inside decisions, thresholds, and internal links instead of being dumped into a keyword list.
- Prop EV example: Luka Doncic points or PRA at 32.5 should be checked against projected minutes, usage without key teammates, pace, spread, and back-to-back fatigue before price.
- MLB: a Dodgers at Rockies first-five total of 5.5 should account for starter xFIP, K-BB%, handedness, Coors Field run environment, wind, bullpen rest, and umpire zone.
- NHL: a Maple Leafs puck-line price at +160 needs confirmed goalie, 5v5 expected-goal share, special-teams edge, and empty-net probability before the margin bet makes sense.
- UFC: an Islam Makhachev-style grappling favorite needs takedown entries, control time, get-up rate, and submission exposure; an Alex Pereira-style striker needs knockdown equity and round-by-round cardio risk.
- DFS value example: NBA showdown builds need projected minutes, usage, salary, ownership, and late-swap flexibility before a star salary is worth paying.
- Stack example: an NBA same-game entry with Doncic points, teammate assists, and opponent threes needs one coherent pace script instead of three unrelated legs.
The goal is not to mention every star. It is to show how the model changes when the example changes from Doncic to Shohei Ohtani, Igor Shesterkin, Connor McDavid, or Tom Aspinall. Revisit and update the board when lineups, minutes, starters, goalie confirmations, weigh-ins, or market prices change.
Educational analysis only, not a bet recommendation. Model outputs can be wrong, markets move, and sports data can contain injuries, role changes, reporting gaps, and contest-specific constraints.