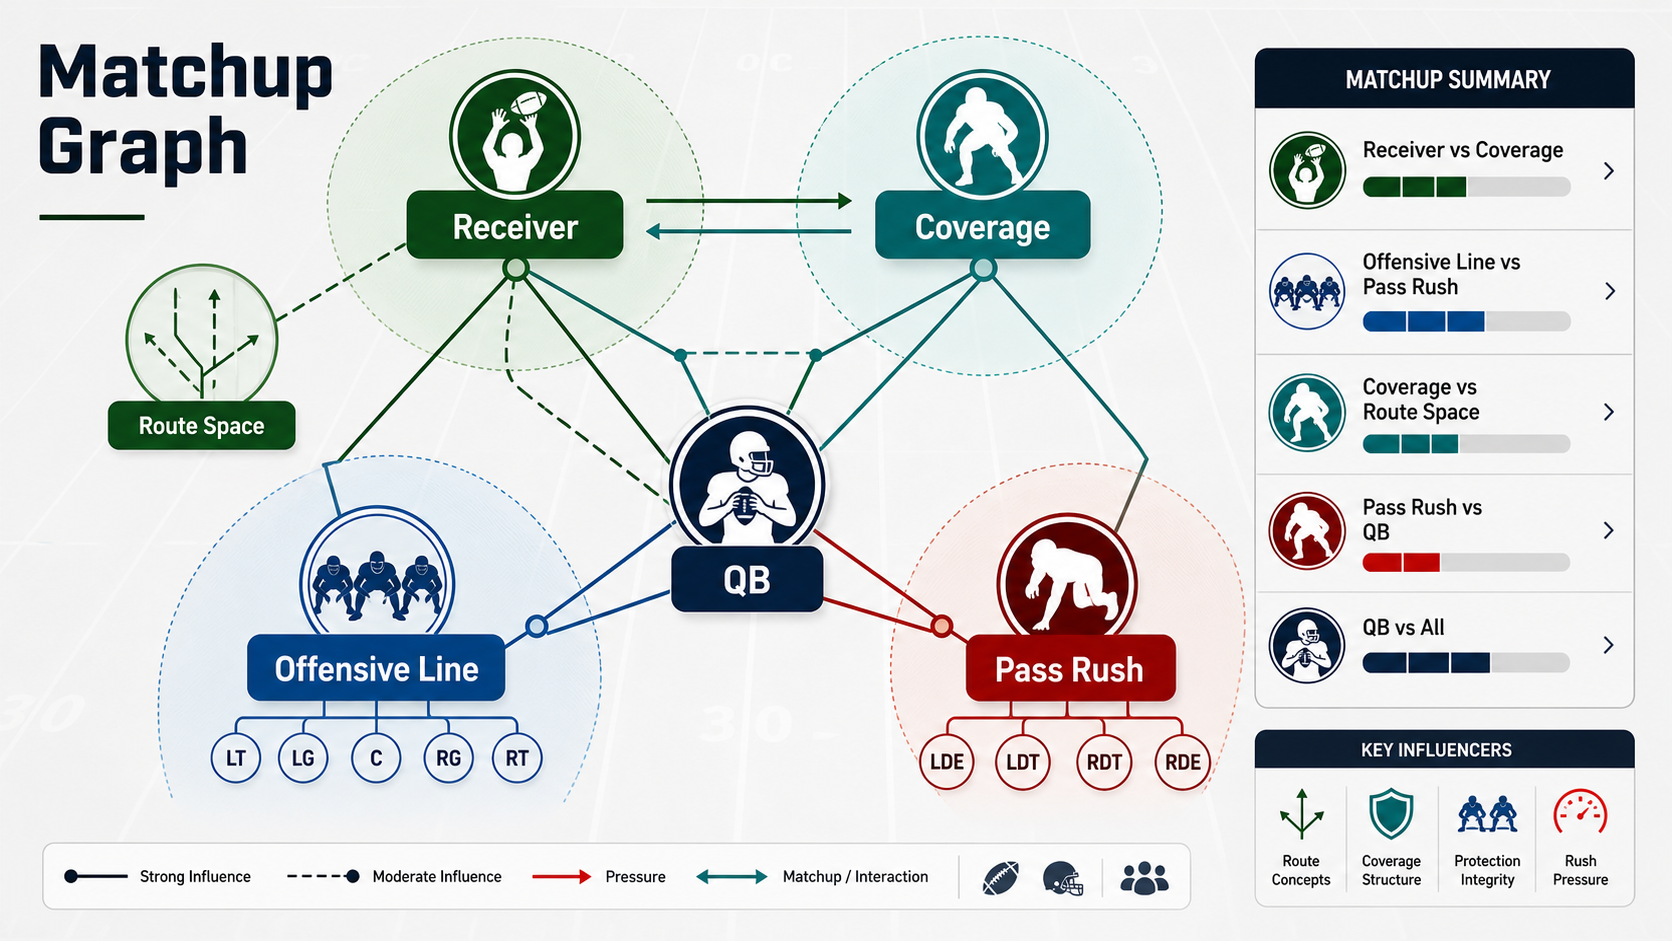

Why does a receiver projection depend on the corner, safety shell, pass rush, quarterback, and offensive line around the play? That is the practical question behind this method family. Graph models represent sports as connected parts. Instead of treating a player as isolated, they let the model see relationships: receiver to corner, quarterback to pass rush, offensive line to protection, and team to opponent.
The plain-English version
Graph models represent sports as connected parts. Instead of treating a player as isolated, they let the model see relationships: receiver to corner, quarterback to pass rush, offensive line to protection, and team to opponent.
The novice trap is to treat the method name as magic. The useful move is to ask what information the method can learn, what it cannot learn, and what kind of sports question it is actually built to answer. A method that is excellent for ranking team strength can be poor for a single player prop, and a method that wins a backtest can still be unbettable if the edge appears only after the market has moved.
Start with the target. A spread model, moneyline model, player prop projection, DFS lineup optimizer, and fantasy ranking all answer different questions. Then check the timestamp of every feature. If the feature would not have been known before the bet, contest lock, or lineup decision, it does not belong in the model. Finally, compare the output to the right benchmark: the closing line, the posted prop, the field ownership, or the best available projection.
Method-by-method guide
gnn-matchup
A graph neural network matchup model passes information across connected players, units, or teams to learn relationship-aware projections. In sports terms, this is the part of the model that decides how to translate noisy pre-game inputs into a usable betting, fantasy, or DFS signal instead of a loose opinion.
Where it helps: For a receiver, it can connect coverage, pass rush, quarterback, offensive line, and route context before projecting volume. The practical test is whether the block improves decisions on games it has not seen, not whether it explains last night's box score after the answer is known.
Where it fails: It can overcomplicate the problem if the graph edges are speculative or if the sample is too small for each matchup type. The fix is usually cleaner targets, stricter time cuts, a smaller feature set, or a calibration layer before the output reaches a staking or lineup workflow.
gat-matchup-tfjs
A graph attention network learns which connected neighbors deserve more weight in a given matchup context. In sports terms, this is the part of the model that decides how to translate noisy pre-game inputs into a usable betting, fantasy, or DFS signal instead of a loose opinion.
Where it helps: It helps when the relevant defender, pass rush, or safety help changes from week to week and should not be weighted equally. The practical test is whether the block improves decisions on games it has not seen, not whether it explains last night's box score after the answer is known.
Where it fails: It can focus on misleading neighbors if the graph contains noisy links or the attention is not validated out of sample. The fix is usually cleaner targets, stricter time cuts, a smaller feature set, or a calibration layer before the output reaches a staking or lineup workflow.
opponent-adjusted
Opponent adjustment rescales player or team outputs based on the quality and style of the opponent. In sports terms, this is the part of the model that decides how to translate noisy pre-game inputs into a usable betting, fantasy, or DFS signal instead of a loose opinion.
Where it helps: It keeps a receiver projection from treating targets against weak coverage the same as targets against a strong secondary. The practical test is whether the block improves decisions on games it has not seen, not whether it explains last night's box score after the answer is known.
Where it fails: It can double count matchup strength if similar information already flows through graph edges. The fix is usually cleaner targets, stricter time cuts, a smaller feature set, or a calibration layer before the output reaches a staking or lineup workflow.
Sports walkthrough
For an NFL receiver, the projection is not just target average. Coverage can reroute him, pass rush can shorten the quarterback clock, offensive line play can change route depth, and opponent-adjusted context can explain why the same target share means different things in different matchups. Graphs put those dependencies into the structure of the model.
Concrete names keep the model honest: Justin Jefferson can draw safety attention that changes teammates, JaMarr Chase can stress coverage leverage, and CeeDee Lamb can depend on pass protection and slot usage as much as raw target share. Those examples are not there to imply a pick; they force the workflow to deal with real role changes, injury context, usage shifts, opponent quality, and market reaction instead of abstract rows in a table.
The workflow is deliberately boring. Define the event, gather only pre-decision information, produce a projection or probability, compare it with the market or contest environment, size the action conservatively, and then record what happened. When the number closes, the closing price becomes the first audit. When the game finishes, the outcome becomes the second audit. Over a useful sample, both audits matter more than whether one bet won.
Validation workflow
Validate this method family in the same shape it will be used live. Train on older games, tune on a later slice, and reserve the newest window for the final check. If the method uses player props, keep player identity, team context, injury status, and market number aligned to the timestamp when the decision would have been made. If it uses DFS simulations, lock the slate, salary, ownership, and injury assumptions before grading lineups.
Compare against a plain benchmark before celebrating lift. A model should beat a naive average, a market-only view, and a smaller interpretable version before the extra complexity deserves product space. The important comparison is not whether the method can explain the past; it is whether it improves decisions after fees, vig, contest rake, stale lines, and real lineup constraints are included.
Review failures as carefully as wins. A losing pick that beat the close can still be a useful process signal, while a winning pick that took a bad number can be a warning. Group errors by sport, market, player role, team, confidence bucket, and price range so the builder can tell the difference between normal variance and a broken assumption.
Expert notes
The graph structure is a modeling decision. Bad edges create bad learning. Connect relationships that exist in the sport, not every player to every other player because the tool allows it.
Graph attention can identify influential neighbors, but attention weights are not a scouting report by themselves. Validate against matchup logic and holdout games.
Opponent adjustment remains important because graph features can accidentally restate team quality. Separate individual matchup effects from team-level strength where possible.
Graphs are most useful when relationships change by opponent or lineup. If the relationship is static and simple, a tabular matchup feature may be enough.
When not to use this family
Do not use a method just because it is more advanced than a baseline. If the data is thin, the target is unstable, the sport context changed, or the market already absorbs the signal, a simpler model with better validation is usually the better tool. The warning sign is a model that needs a long explanation for why its live results should be ignored.
Watch for leakage, repeated samples, and hidden correlation. A player prop model can accidentally learn same-game information through closing lines, a DFS optimizer can double count teammate correlations, and a ratings model can overstate certainty after one noisy result. If a method cannot survive a walk-forward split, a holdout season, and a calibration check, keep it in research.
Decision checklist
| Modeling question | Useful block | Risk check |
|---|---|---|
| What is the cleanest baseline for this sports decision? | gnn-matchup | Confirm the target, feature timestamp, and market comparison are all aligned before training. |
| Which block adds lift without turning noise into confidence? | opponent-adjusted | Compare walk-forward performance, calibration, and closing-line value before trusting the output. |
How Shark Snip uses it
Shark Snip uses gnn-matchup, gat-matchup-tfjs, and opponent-adjusted blocks when player or unit projections depend on connected matchup context rather than isolated averages.
The block names above are intentionally visible in this article so model builders can connect the concept to the actual building blocks in Tinker, DFS simulation, and the model marketplace. Shark Snip treats these methods as components in a workflow: feature preparation, model fit, probability repair, portfolio construction, and post-game evaluation. No block is allowed to skip validation because every sport has small samples, changing incentives, and noisy injury information.
The most useful model is not the one with the most intimidating name. It is the one whose assumptions match the sport question, whose inputs were available at decision time, whose output is calibrated enough to compare with a price, and whose failures are visible before real bankroll or contest exposure is increased.
Related reading and tools
Keep going with building your first model with Tinker, closing-line value, bet tracking. These links connect the method family to the betting, DFS, and model-building workflows readers already use.
Named modeling examples
A model page is more useful when the feature examples are concrete. Josh Allen rushing attempts, Ja'Marr Chase target share, Nikola Jokic assist rate, Tarik Skubal strikeout projection, Igor Shesterkin starter confirmation, and Islam Makhachev control time are all different prediction problems. A single “player form” feature cannot explain them all, so the model needs sport-specific inputs and review notes.
- NFL: separate route participation, pressure rate, and red-zone role from box-score volume.
- NBA: separate usage, minute projection, pace, and back-to-back fatigue.
- MLB: separate starter skill, handedness, park, weather, and lineup confirmation.
- NHL and UFC: late confirmations and fight-week news can matter more than a season average.
Model inputs worth naming
Use names as evidence, not decoration. The useful SEO win is that Justin Jefferson, CeeDee Lamb, Josh Allen, Ja'Marr Chase and Bijan Robinson and Chiefs, Bills, Eagles and Lions appear inside decisions, thresholds, and internal links instead of being dumped into a keyword list.
- NFL model: route participation for Ja'Marr Chase, rushing attempts for Josh Allen, pressure rate allowed by the Bengals, and red-zone carry share for Jonathan Taylor should be separate features.
- NBA model: usage, projected minutes, rest, and pace should move Nikola Jokic or Shai Gilgeous-Alexander props differently than a one-number power rating.
- MLB model: Tarik Skubal strikeout projection, Coors Field park factor, lineup confirmation, and bullpen rest need their own columns.
- Review loop: grade entry price, closing price, bet result, and model error separately so lucky results do not hide bad forecasts.
Build or audit the workflow in Tinker and review it with CLV.
Educational analysis only, not a bet recommendation. Model outputs can be wrong, markets move, and sports data can contain injuries, role changes, reporting gaps, and contest-specific constraints.