Most bettors lose long before their picks do. They lose because they never decided in advance how much of their roll a single bet should risk, and one cold week wipes out three months of slow grinding. Bankroll management is the boring part of sports betting that nobody clicks on, and it is also the single biggest predictor of whether an account is still alive a year from now. This guide walks through unit size, flat betting, and the math that explains why bet sizing matters far more than which side of a game you took.
Why bankroll management matters more than picks
If you hit 55 percent of your bets at -110, you are a winning bettor. That is rarefied air. But that 55 percent does not arrive evenly. Even at a 55 percent true win rate, you will hit losing streaks of seven, eight, even ten in a row. The math says so. If your bet size is too aggressive relative to your bankroll, one of those streaks ends your run, even though your edge was real.
Bankroll management is the practice of sizing bets so that ordinary variance cannot bury you. It does not improve your win rate. It keeps your account alive long enough for your win rate to show up.
What is a bankroll?
A bankroll is the dollar amount you have set aside specifically for sports betting. It is not your savings, not next month's rent, not money you would feel devastated to lose. It is risk capital — money that, if it went to zero tomorrow, would change your mood but not your life.
Once you have set a bankroll, every sizing decision flows from that number. Pretending your bankroll is bigger than it is — sizing bets relative to "the money I'll have when I get paid Friday" — is the most common rookie mistake.
Units: the universal sizing language
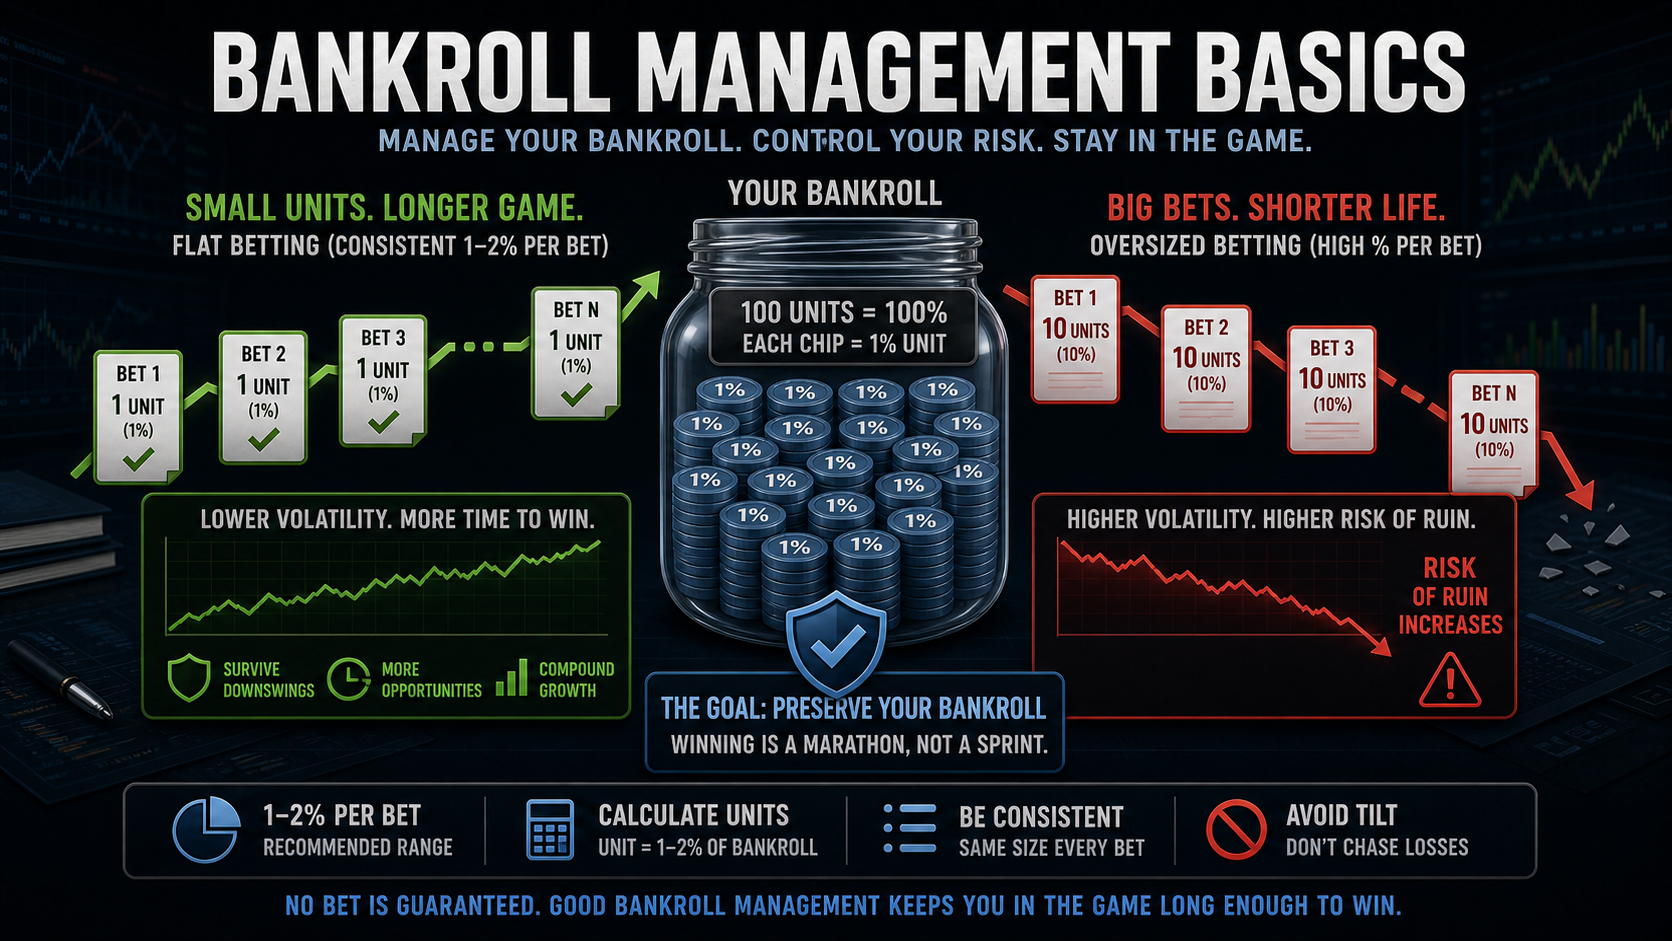
A unit is a fixed percentage of your bankroll, usually 1 to 2 percent. If your bankroll is $2,000, a 1 percent unit is $20. A "two-unit" play would be $40. A "half-unit" is $10.
Why use units instead of dollars? Three reasons:
- It scales. As your bankroll grows or shrinks, your unit grows or shrinks with it. You stay in the same risk lane.
- It makes record-keeping honest. You can compare your performance to anyone else's regardless of who has more money.
- It removes emotion. "I'm betting one unit" is a rule. "I'm betting $200 because I really like this one" is a feeling.
Flat betting vs scaling stakes
The simplest, hardest-to-mess-up plan is flat betting: every bet is exactly one unit. No "this one is a mortal lock," no "I have a really strong feel on Josh Allen in primetime," no doubling up after a loss. One unit, every time.
Flat betting wins for one ugly reason: most bettors are bad at telling their A-bets from their B-bets. Studies of tracked bet logs show that the bets people feel strongly about do not actually win at higher rates than the ones they bet routinely. Until you have hundreds of logged bets proving otherwise, treat every play the same.
Scaling stakes (sometimes called confidence-based sizing) only works if you have evidence that your high-confidence picks really do hit at a higher rate. You can verify that on the model leaderboards for your tracked predictions before trusting your gut. If you want to put confidence tiers under a microscope, build a sizing model in the lab with predicted-probability buckets and let three months of paper bets prove or disprove the gut-feel hypothesis.
The "five tiers and a prayer" failure mode
A common rookie pattern: split picks into 1u, 2u, 3u, 5u, "lock" tiers, then watch the lock tier go 4-12 by November. The reason is statistical. Self-rated confidence is uncalibrated — bettors anchor on recent results and narrative, not on probability. Without a model that outputs explicit win probabilities, every tier above 1u is noise pretending to be signal. If you must scale, scale by computed edge from a model on the model workshop, not by emotional conviction.
The math: variance and ruin probability
Here is a worked example. You are a 53 percent bettor at -110. Your edge per bet is small but real. You have a $1,000 bankroll. Compare two strategies over 1,000 bets:
- 1 percent flat ($10/bet): Your expected profit is roughly $50. Your chance of going broke before getting there is essentially zero.
- 5 percent flat ($50/bet): Same expected profit on paper, but your chance of hitting $0 along the way climbs above 30 percent. One ugly stretch and you are out before the edge can play out.
- 10 percent flat ($100/bet): Now your "ruin probability" is well over 60 percent. You are gambling on never having a 6-bet losing streak, which happens routinely.
The expected value is the same in all three scenarios. The probability of actually collecting that EV is wildly different. Bet sizing is the lever that converts a paper edge into a realized one.
Practical rules of thumb
- 1 percent base unit for most bettors. Increase to 2 percent only if you have a tracked, documented edge.
- Cap parlays at half a unit or less. Variance is much higher and edges are usually smaller than singles; the math gets especially punitive on same-game parlays.
- Cap player props at one unit max. Prop markets are softer, but limits are lower for a reason. A Justin Jefferson receiving prop or Jalen Hurts rushing prop should still fit the same sizing rules.
- Re-size your unit quarterly, not after every win or loss. Drifting up after a hot week is how bettors blow accounts.
- Never chase. "I am down four units, I will bet six to get back to even" is the exact thought that ends accounts.
Sizing by market: spreads vs props vs DFS
One unit is not one number. Different markets have different variance profiles and different hold rates, and your sizing should reflect that. The 1% flat baseline applies to vanilla NFL spreads and totals — the spine of most bettors' books. Everything else gets adjusted.
Spreads and totals: the baseline
At standard -110 juice, NFL and NBA spread/total markets carry the cleanest hit-rate measurement and roughly 4.5% hold. This is where flat sizing works best. A Chiefs -3.5 vs Saints in Week 4 and a Lakers-Suns total in November should both be one unit, full stop. Resist the urge to upsize the primetime game — the line already absorbed the public lean.
Player props: half a unit, hard cap
Prop markets like Justin Jefferson over 92.5 receiving yards or Jalen Hurts over 35.5 rushing yards carry 7-8% hold and softer limits. They are softer for a reason: the books expect public traffic to overwhelm sharp signals. Size at half a unit, and never exceed one full unit on any single prop, even if your model screams. The variance on a single-player line is brutal — Jefferson on a 3-target game vaporizes the read.
Same-game parlays and futures: capped exposure
SGPs run 15-25% hold. Futures (MVP, Super Bowl) run 20%+. You can play them — but cap total weekly SGP exposure at half a unit, and treat any future as a single one-time bet held for months, not a recurring weekly stake. We unpack the math in our SGP guide and the vig and hold explainer.
DFS and contest play
For DFS, treat the whole slate as a single bankroll exposure. A 20-lineup GPP day at $5 each is one bet for sizing purposes, not 20 independent bets. Cap that day at 2% of bankroll. The DFS desk separates cash from GPP so you can size them independently — cash games are lower variance (treat closer to 3-5%) and GPPs are fatter tailed (cap under 1%).
Drawdown psychology — what real bettors actually feel
The math says a 53% bettor at -110 expects 50% drawdowns in any given 500-bet sample. The math also assumes you keep betting through it. Almost no one does.
Watch what happens in practice. A bettor opens at $2,000, hits a hot stretch up to $2,600, then runs into a 0-7 ATS Sunday across the early window. Their bankroll is back to $2,200. The math says "stay flat, the edge is still there." The lizard brain says "I have to fix this." The bettor doubles units to $40 trying to catch back up. The next Sunday goes 2-5. Now they are at $1,800, below their starting point, with shaken confidence and oversized bets still in flight.
This pattern destroys more accounts than bad picks. The defense is procedural, not emotional: write your unit size down before the week starts and do not change it mid-week. Re-baseline only on the first of each month, based on the bankroll number that day. Pre-committing to a sizing rule is the only thing that survives variance because variance always exceeds your gut tolerance.
Tracking is half the battle
You cannot manage what you do not measure. Every bet should go in a log: date, sport, market, bet, line, stake in units, result, and closing line. Once you have a few hundred bets logged, you can answer the only question that matters — am I actually beating the closing line? Bettors who beat the closer over a meaningful sample are real. Bettors who don't are gamblers paying the vig. We cover this in detail in our tracking guide, and the deeper CLV concept in the closing line value explainer.
When to grow your unit
The boring answer: when your bankroll grows. If your starting roll was $2,000 and a 1 percent unit was $20, do not move to a $30 unit until your bankroll is at $3,000 — and only after a documented period of profit, not a hot week.
You want to ride growth, not chase it. The fastest way to give back gains is to ramp up sizing the moment you have them.
Edge cases bankroll rules need to handle
Stock advice covers the median bettor. Real life is messier. A working bankroll plan needs explicit rules for these situations:
- Big winning week, small bankroll. $500 bankroll grows to $750 in three weeks. Your unit went from $5 to $7.50 if you re-sized weekly — but the sample is too small to trust. Keep the $5 unit and re-size at the next quarterly checkpoint.
- Promo and free-bet inflation. A $200 risk-free bet credit is not bankroll until it converts to withdrawable cash. Treat promo balances as separate ledger entries. Sizing off inflated apparent balances is one of the cleanest ways to overbet a real bankroll.
- Multiple sportsbook accounts. Total bankroll = sum across books. Per-book balance is for line-shopping, not sizing. A $2,000 bettor with $400 at five books still bets $20 to $40 per play, not $4 to $8.
- Cross-sport seasonality. NFL bettors who pile into NBA in February without retraining intuition or models often overbet. Treat each sport as a fresh sample until you have a hundred logged plays in it.
- Live betting accounts. Live markets have higher hold and faster cognitive load. Cap live stakes at half a unit until your tracked CLV says otherwise — and remember every live bet competes against a market that updates faster than you do.
The drawdown plan you write before you need it
Every bettor will hit a stretch where the bankroll drops 20 to 30 percent. The math guarantees it. The question is whether you have a written response ready before the streak starts. A useful template:
- −10 percent drawdown. Pause adding bets. No new sports, no new market types. Continue with current model picks at current sizing.
- −20 percent drawdown. Cut unit size in half for two weeks. Audit recent bets for CLV — if CLV is positive, the drawdown is variance and the half-size buys time. If CLV is negative, the model or read has degraded and needs investigation.
- −30 percent drawdown. Stop betting. Rebuild from a smaller bankroll using the original 1 percent unit on the remaining roll. Do not chase the prior peak. The peak is irrelevant; only the next bet matters.
Writing this plan in advance is the single highest-leverage thing a new bettor can do. Drawdowns destroy bankrolls because the rules get invented mid-streak, when emotion is loudest.
Bankroll allocation across products
Modern bettors have more surfaces than ever — straight bets, DFS contests, prediction markets, fantasy leagues, peer-to-peer prop sites, and tournaments on the card marketplace. The temptation is to size each one independently and let total exposure drift. Don't. Allocate the whole bankroll across products in advance:
- Core (60 to 75 percent): straight bets at your tracked, edge-confirmed markets.
- Speculative (15 to 25 percent): player props, parlays, futures — markets with higher variance and softer edges.
- Tournaments and contests (5 to 15 percent): DFS, pick'em pools, peer markets where outcomes are correlated and entry fees act as the stake. The bracket-style events on the gridiron tournament page belong in this bucket, not the core.
The buckets stop you from accidentally allocating 30 percent of your bankroll to a parlay because it "feels small."
Bottom line
Bankroll management is unsexy. It is also the only thing standing between a bettor with edge and an account at zero. Pick a bankroll you can lose. Bet 1 to 2 percent of it per play. Stay flat until you have data proving you should not. Track everything, re-size quarterly, and never chase. The math does the rest.
If you want to put real edge behind your bets, build and stake models in the workshop at sensible unit sizes. Your edge is one piece of the puzzle. Your sizing is what lets the puzzle finish. Once a model has documented CLV across a real sample, continue with the Kelly Criterion guide for variable sizing — and read the CLV explainer to verify the edge is real before scaling stakes.
Bet responsibly — set limits, never chase losses.
Price examples and pass rules
Use names as evidence, not decoration. The useful SEO win is that Josh Allen, Jalen Hurts, Justin Jefferson, Ja'Marr Chase and Bijan Robinson and Chiefs, Bills, Eagles and Lions appear inside decisions, thresholds, and internal links instead of being dumped into a keyword list.
- Spread example: if Chiefs-Broncos opens Chiefs -3.5 and your fair number is -2.8, +3.5 is the bet, +3 is a pass, and the moneyline needs roughly +155 or better before it replaces the spread.
- Total example: if a Bills outdoor total opens 46.5 and wind moves from 8 mph to 21 mph, an under projection at 42.8 still needs a playable number; under 45 or better is different from chasing 43.5.
- Futures example: Bengals AFC North +280 is 26.3% before hold. If your fair number is 30%, stake modestly, track portfolio correlation, and avoid stacking every Burrow, Chase, and Higgins bet into the same thesis.
- CLV rule: a good write-up is not enough. Track whether the spread, total, prop, or futures price closed better than your entry before grading the process.
Use closing-line value guide, vig and hold guide, bet tracking workflow to keep the examples attached to measurable prices.
Research note board
Use this table to turn the guide into a decision note. The point is to know when the idea is actionable and when it is only context.
| Angle | Input to verify | Example application | Pass when |
|---|---|---|---|
| Market price | Spread, total, moneyline, prop price, or futures hold | Chiefs and Bills compared through closing line value | The price has moved past the number that created the edge |
| Football or sport context | Role, pace, weather, injury status, opponent style | Josh Allen role news mapped to the relevant market | The original input changes or remains unconfirmed |
| Review loop | Entry, close, result, and reason code | CLV logged with a clear thesis | You cannot explain whether the process beat the market |
Expected bankroll growth at 55% edge
Expected geometric growth of a $100 bankroll under different Kelly multipliers across 1000 bets at p=0.55, decimal=2. Full Kelly maximises long-run growth but produces the deepest drawdowns; fractional Kelly trades growth for variance.
Drawdown by Kelly fraction
Median and 95th-percentile max drawdown by Kelly fraction over a 1000-bet horizon. Halving Kelly almost halves drawdown; quartering it cuts drawdown by ~70%. Figures are illustrative ballparks from the Kelly literature.