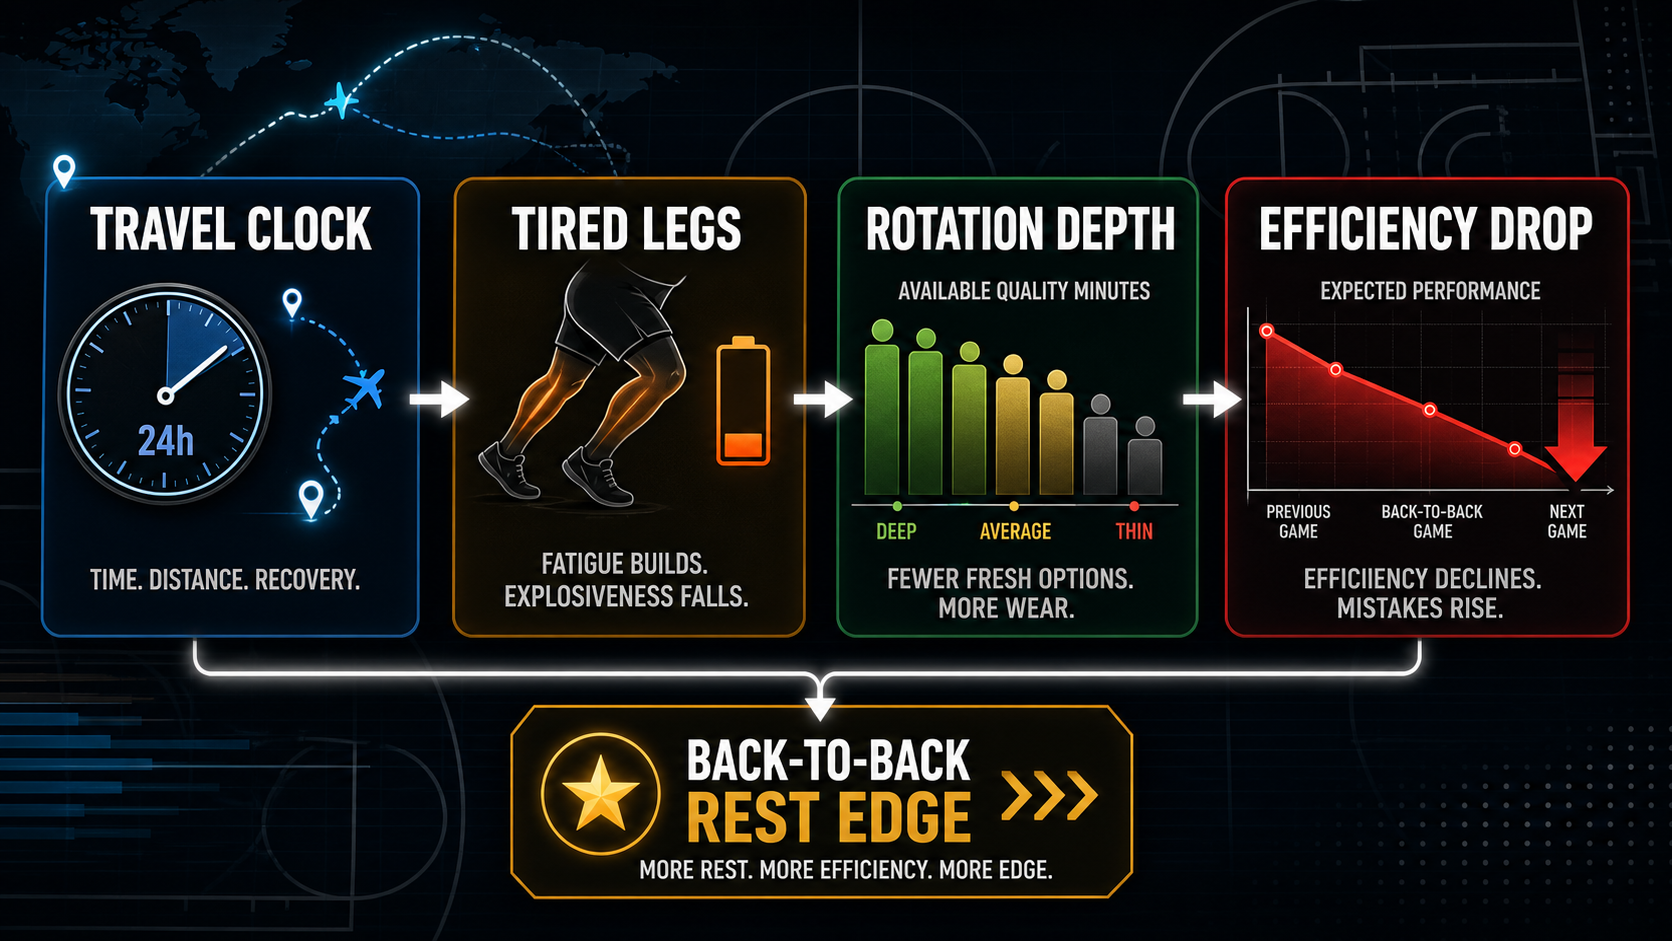
The NBA schedule produces about 14 back-to-back sets per team per season. That is 14 nights of compressed travel, half-recovered legs, and rotation changes — and it is one of the most reliable signal sources in the league. NBA back to back betting is not a single strategy, it is a family of angles: rest spreads, total drops, prop unders, and live spots that the market still under-prices. This piece walks through the structure of the schedule edge, where it shows up most cleanly, and the mistakes that turn an obvious read into a losing bet.
What "back-to-back" actually means
A back-to-back is two games on consecutive calendar days. The variants are:
- Home-home — least taxing, no travel, modest signal.
- Home-away — moderate travel after a late game, real signal.
- Away-home — overnight flight back, moderate signal.
- Away-away — the heaviest version, late finish followed by travel and another road game.
The fourth variant, especially with time-zone travel, is where the deepest edges live. Books price some of the schedule effect in but rarely all of it.
How fatigue shows up in the data
Across many seasons of NBA data, second-night-of-back-to-back teams underperform their season averages in three measurable ways:
- Three-point percentage drops by about 1.5-2 percentage points.
- Free throw rate falls by 5-8% as drives slow down.
- Defensive rotations degrade, costing 2-3 points per 100 possessions.
That combination — slightly worse offense, noticeably worse defense — is why second-night teams cover the spread less often and why their totals lean under in low-pace matchups but over in pace-amplifying ones.
Why the spread market under-prices fatigue
Books typically adjust the spread by 1-1.5 points for a back-to-back team. The actual scoring impact, when fatigue compounds with travel and an opponent on multiple days rest, can be closer to 2.5-3 points. That gap is where the angle lives.
The pattern is most reliable when:
- The fatigued team is on a 4-in-6 or 5-in-7 stretch.
- The opponent has had at least 2 days of rest.
- The previous game was a high-leverage overtime or a heavy minutes night for the starters.
If you are testing rest as a feature in your own spread model, the Shark Snip Workshop exposes days-of-rest, miles traveled, and minute-load features. Spin up a fresh rest-aware spread brick from /build/new and the schedule-edge inputs are pre-wired.
A worked example
Suppose the Lakers play a Tuesday night home game that goes to overtime, then fly to Denver for a Wednesday night game. Their starters logged 40+ minutes, the flight lands at 2am, and the opponent has been home for three days. The book hangs Denver -6 with a total of 226.
The honest math: -1.5 from the schedule, -1 from minute load, -0.5 from altitude adjustment, -0.5 from the OT leg fatigue. That is roughly a 3.5-point fatigue tax. The fair spread is closer to Denver -8 or -8.5. The Lakers covering at -6 is more like a coin flip; Denver covering -6 is more like 60%. The market priced about half the edge.
The total is also worth a look. Fatigued teams produce fewer free throws, so possessions end faster and points-per-possession drops. The under at 226 has support, especially against a top-12 defense.
Player prop angles on the second night
The schedule edge concentrates in specific prop markets. The cleanest ones:
- Threes-made unders for the fatigued team's perimeter shooters.
- Free throws made unders for high-FTA scorers — drives slow, attempts drop.
- Points unders for stars on a minutes restriction. Coaches sometimes cap stars at 30 minutes on the second night without announcing it.
For real-time minutes-restriction signals and rest-adjusted prop projections, the Gridiron dashboard highlights schedule context next to each market line.
The opposite angle: well-rested teams
The flip side of fatigue is that the well-rested opponent is often slightly underrated by the market. A team coming off 2-3 days rest, especially at home, plays better than its season-long numbers suggest.
- Their bench rotation is fresh, which extends the high-effort minutes.
- Their three-point percentage trends 1-2 points above season average.
- They tend to start hot — first-quarter spreads on rested home teams produce a small but real edge.
Common mistakes in B2B betting
- Betting every back-to-back team to lose. The market prices most of the edge in. You need the structural extras — overtime, travel, opponent rest — to push the angle from coin flip to real value.
- Ignoring direction of travel. Eastward travel is harder than westward. A West-to-East second-night team underperforms more than the reverse.
- Overusing the angle in early-season games. Rest matters more in the back half of the season as cumulative load builds.
- Forgetting playoff implications. Late-March back-to-backs for teams locked into seeding sometimes feature heavy minute restrictions on stars, which moves prop unders more than spreads.
How to use rest in your workflow
The cleanest workflow is to apply a rest adjustment after the spread and total are projected from the talent and pace inputs, not before. That keeps the rest signal independent and prevents double-counting. Build a small lookup of rest deltas — 0 for normal, -1.5 for second-night home-home, -2.5 for second-night away-away with travel — and apply it as the last layer.
For in-season rest-adjusted picks and the daily schedule edge view, see the Gridiron board, browse community rest-aware models on the Marketplace, and check the leaderboards for which models weight rest most heavily.
Live betting on second-night teams
Live markets give you a second window on the schedule edge. Fatigued teams often start games competently — adrenaline carries the first quarter — and then fade in the third quarter as legs go. Live unders on second-night teams trailing by 6+ at halftime convert at a meaningfully higher rate than the implied price.
- Third-quarter unders in fatigue spots are the most repeatable live read.
- Second-half spreads on the rested team often shade favorably as the fatigued team's bench rotation gets exposed.
- Live moneylines on rested home favorites trailing at the half can be a small value if their starters are still fresh.
Live markets reset the line every possession, so the schedule edge that was fully priced in pre-game can re-emerge as the game develops.
Rest, pace, and the totals connection
The schedule edge is not just a spread story — it interacts with pace in ways that flip the totals read. A fatigued team facing a slow opponent produces an under almost mechanically: fewer possessions plus slightly slower scoring per possession compounds. But a fatigued team facing a top-5 pace opponent often pushes the over despite tired legs, because the defensive degradation (the largest fatigue effect) outweighs the offensive drop, and pace-driven extra possessions amplify the gap. Read the totals direction off the opponent's pace profile, not just the fatigue level. The companion NBA pace and spread guide walks through the tempo-amplification math in detail.
Three repeatable totals patterns in fatigue spots:
- Unders when both teams are bottom-15 in pace and the fatigued team plays the second night of an away-away.
- Overs when the fatigued team faces a top-10 pace offense — defensive degradation dominates.
- First-half overs for the rested home team when the visitor flew in overnight — adrenaline carries the first 6-8 minutes before fatigue catches the visiting team in Q2.
Bottom line
Back-to-back games are one of the few NBA edges that is both well-documented and persistently under-priced. The market adjusts but rarely fully, especially when fatigue compounds with travel and opponent rest. Apply the adjustment as the last layer in your projection, focus on the cleanest variants (away-away with travel after a high-minute game), and look at the prop board where the schedule signal is even less efficient.
Bet responsibly — set limits, never chase losses.
NBA example board
Use the named prop board instead of a generic “good matchup” note. Nikola Jokic assist and rebound props should start with touch volume and whether Denver is using him as a hub. Shai Gilgeous-Alexander points props should start with free-throw equity, opponent rim pressure, and whether the market has already priced his usage. Luka Doncic PRA props, Jayson Tatum three-point volume, and Victor Wembanyama blocks or rebounds each need different inputs even when the headline market looks similar.
- Jokic assists: check teammate shooting availability, pace, and whether the defense sends help early.
- Shai points: separate true usage from a public star tax when the Thunder are heavily favored.
- Doncic PRA: watch blowout risk because rebounds and assists can disappear before points do.
- Tatum threes: price attempts, not only make rate, especially against switch-heavy defenses.
- Wembanyama blocks and rebounds: account for opponent rim attempts, foul risk, and minute stability.
How to keep NBA examples from going stale
Recheck the Celtics, Thunder, Nuggets, and Spurs context before acting because rotations move quickly around rest, injuries, and playoff leverage. The example is still useful if the player changes teams or the line changes, as long as the input stays explicit: minutes, usage, pace, matchup, and price. Pair this with reading NBA player props and NBA prop market structure when you need a deeper prop workflow.
Sport-specific model signals
Use names as evidence, not decoration. The useful SEO win is that Josh Allen, Ja'Marr Chase, Bijan Robinson and Puka Nacua and Chiefs, Bills, Eagles and Lions appear inside decisions, thresholds, and internal links instead of being dumped into a keyword list.
- Prop EV example: Luka Doncic points or PRA at 32.5 should be checked against projected minutes, usage without key teammates, pace, spread, and back-to-back fatigue before price.
- MLB: a Dodgers at Rockies first-five total of 5.5 should account for starter xFIP, K-BB%, handedness, Coors Field run environment, wind, bullpen rest, and umpire zone.
- NHL: a Maple Leafs puck-line price at +160 needs confirmed goalie, 5v5 expected-goal share, special-teams edge, and empty-net probability before the margin bet makes sense.
- UFC: an Islam Makhachev-style grappling favorite needs takedown entries, control time, get-up rate, and submission exposure; an Alex Pereira-style striker needs knockdown equity and round-by-round cardio risk.
- DFS value example: NBA showdown builds need projected minutes, usage, salary, ownership, and late-swap flexibility before a star salary is worth paying.
- Stack example: an NBA same-game entry with Doncic points, teammate assists, and opponent threes needs one coherent pace script instead of three unrelated legs.
The goal is not to mention every star. It is to show how the model changes when the example changes from Doncic to Shohei Ohtani, Igor Shesterkin, Connor McDavid, or Tom Aspinall. Revisit and update the board when lineups, minutes, starters, goalie confirmations, weigh-ins, or market prices change.
Research note board
Use this table to turn the guide into a decision note. The point is to know when the idea is actionable and when it is only context.
| Angle | Input to verify | Example application | Pass when |
|---|---|---|---|
| Market price | Spread, total, moneyline, prop price, or futures hold | Chiefs and Bills compared through spreads | The price has moved past the number that created the edge |
| Football or sport context | Role, pace, weather, injury status, opponent style | Josh Allen role news mapped to the relevant market | The original input changes or remains unconfirmed |
| Review loop | Entry, close, result, and reason code | totals logged with a clear thesis | You cannot explain whether the process beat the market |
EV per $100 across win rate × odds grid
Expected value of a $100 stake at each combination of true win rate and market odds. Anywhere the cell is positive you have a long-run profitable bet; the magnitude shows how aggressive Kelly will size it.
Breakeven win % at common American odds
The win rate you need to break even at each price. Pick odds shorter than -150 and you must win >60% just to stay flat — a hurdle most casual handicappers never sustain.